

The Directional Movement Index (DMI) is a popular technical indicator traders use to identify trend strength and potential trading opportunities. Developed by J. Welles Wilder, DMI helps traders understand a market trend’s direction, strength, and duration. In this blog post, we will delve into the intricacies of the DMI indicator and explore effective trading strategies to maximize its potential.
What is DMI?
The Directional Movement Index is a tool traders use to assess the presence and strength of trends in the market. J. Welles Wilder created it during the mid-1970s.
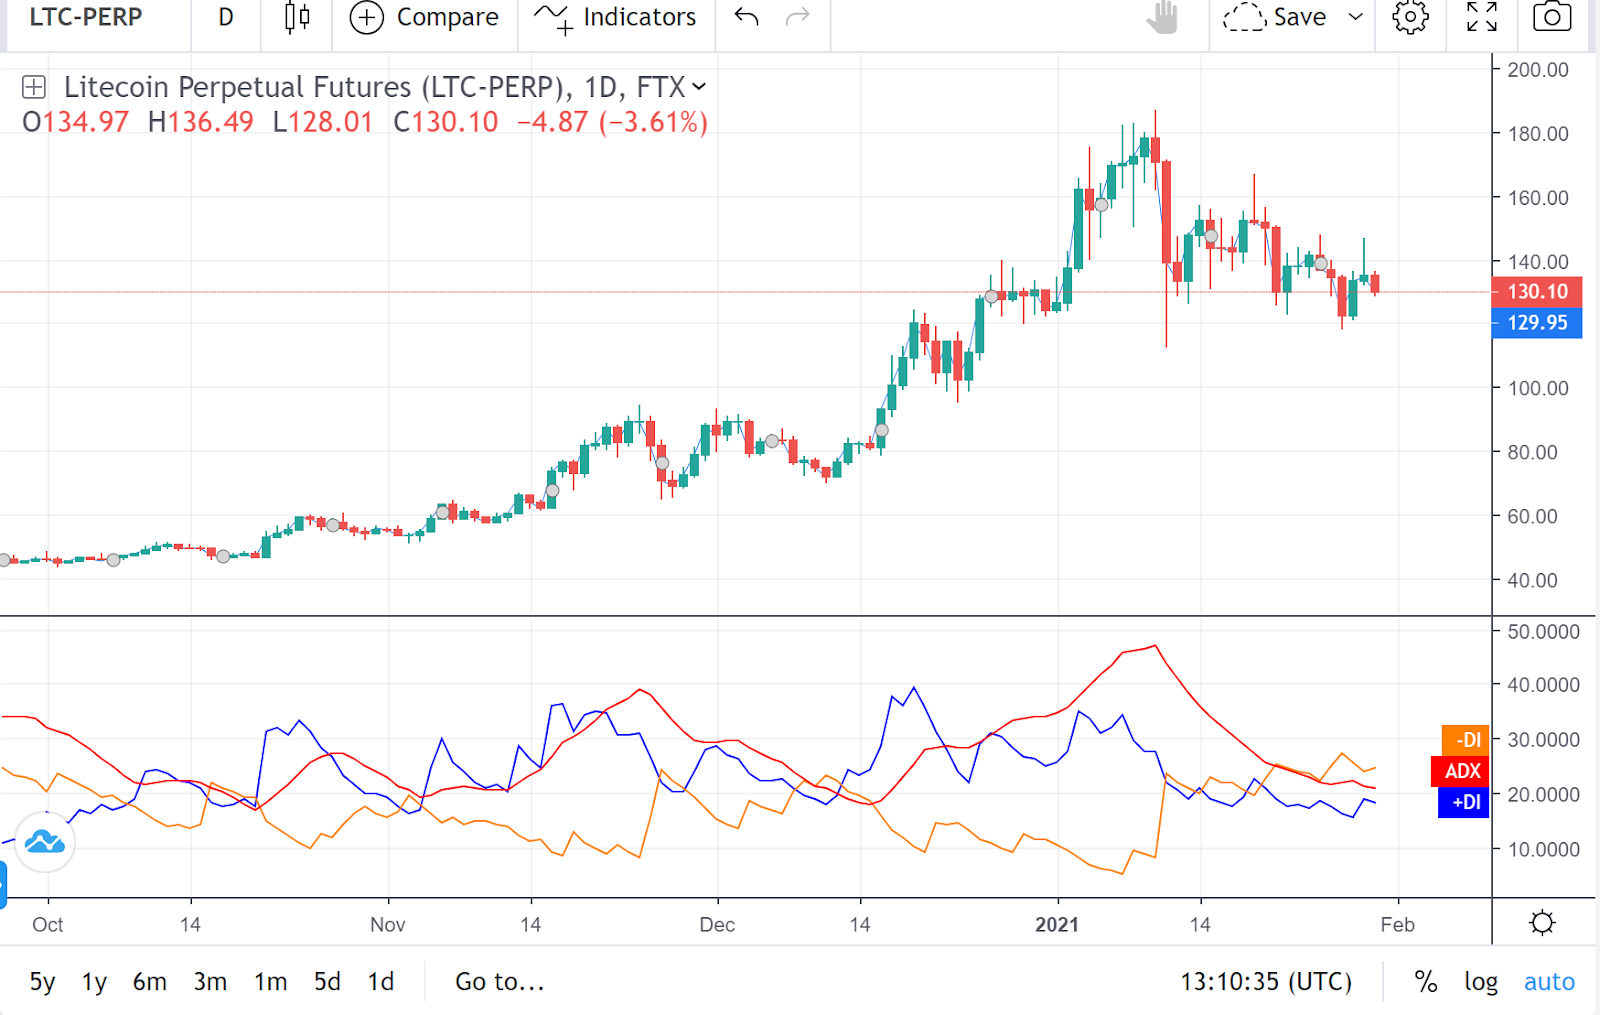
DMI is composed of three sub-indicators:
- The ADX (Average Directional Movement) line: This line specifically measures the intensity of a trend irrespective of its direction.
- The +DI (Directional Indicator +) line: This line indicates an upward trend.
- The -DI (Directional Indicator -) line: This line signifies a downward trend.
What does the DMI indicator mean?
The DMI indicator, also known as the Directional Movement Index, was developed by J. Welles Wilder in the 1970s. Although its calculation formula is complex, it can be easily utilized through technical analysis software or online charting tools. The DMI serves various functions, including assessing the strength and weaknesses of trends and identifying favorable or unfavorable trading signals.
What trading signals does the DMI indicator provide?
MI. indicator provides trading signals for the direction and strength of a trend.
The direction of the trend is indicated by two lines: +DI and -DI.
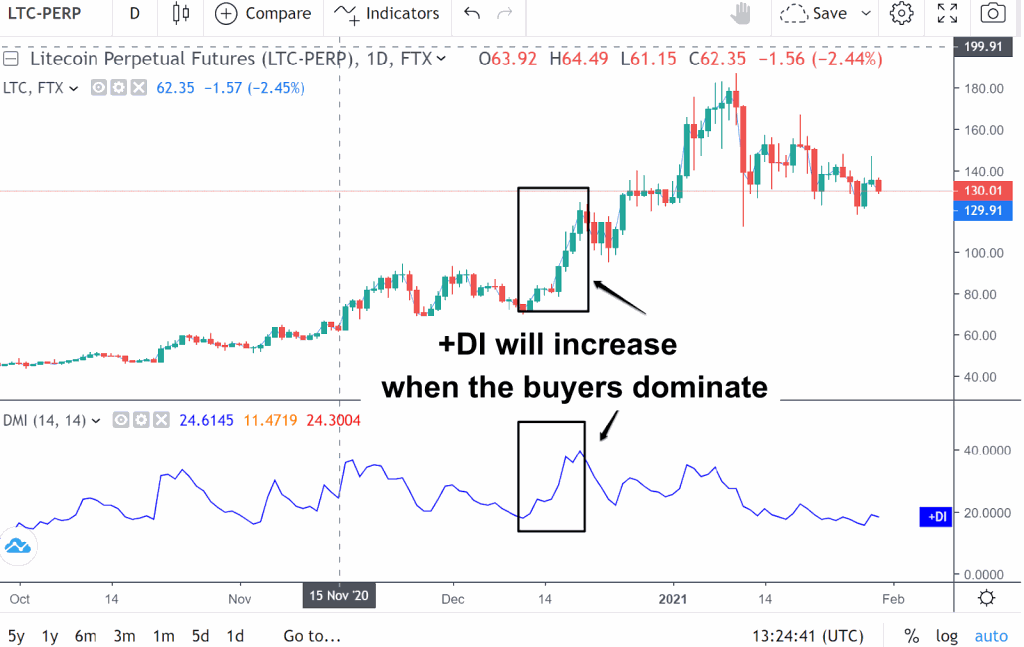
- The +DI line represents a strong uptrend where buyers dominate.
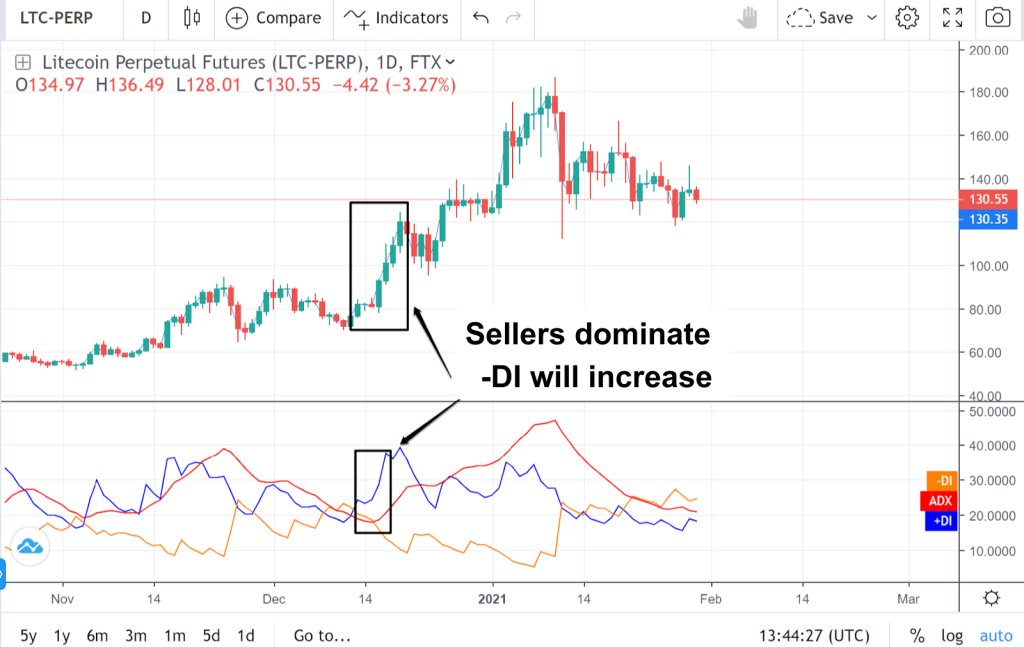
- The -DI line represents a downtrend where sellers are dominating.
Strength of the trend:
The ADX line determines the strength of the trend. This line ranges from 0 to 100. The more the ADX line moves toward 100, the stronger and clearer the trend is. On the contrary, if the ADX line approaches 0, the market cannot determine the trend; the trend is not clear.
The strength of the trendline is clearly demonstrated as follows:
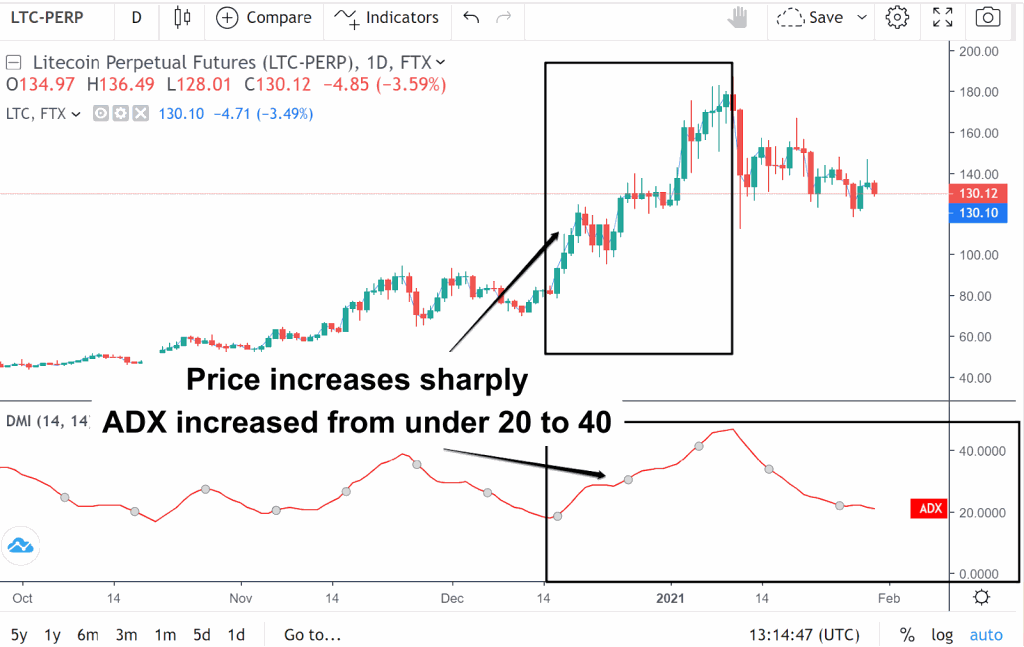
- ADX < 20: The market is not trending.
- ADX increased from under 20 to: The market is starting a new trend.
- 20 <= ADX <=40: The trend is increasing, and the market is getting stronger.
- ADX > 40: very strong trend line.
- ADX > 50: The trend is continuing to the upside.
- ADX > 70: the trend is extremely strong, but this is rare.
Recipe
DMI is a set of 3 indicators combined into one:
- The +DI (Directional Indicator +) line: this is an indicator representing an uptrend. +DI will increase when the buyers dominate.
- -DI (Directional Indicator -) line: indicates a downtrend; when sellers dominate, -DI will increase.
- ADX (Average Directional Movement): The ADX line helps determine the direction’s strength and weakness, regardless of whether the direction is bullish or bearish.
- ADX below 20: The market is not trending.
- Rise from bottom to 20: Start of a new trend.
- Ranges from 20-40: The case where the ADX rises from 20 to 40 confirms the trend when it rises from below to 20, and the trend is strong.
- Above 40: Very strong trend.
- Cut above 50: Trend continues.
- Rise to 70: It’s rare for such a strong trend to happen.
The calculation of the DMI is predicated upon comparing the range of high and low prices from the previous day to those of the current day. Subsequently, the system will evaluate whether today’s price range is greater or lesser than that of the previous day and aggregate the outcomes within each time frame. Given that the DMI system comes pre-installed on the chart, there is no pressing need to dwell excessively on the intricacies of its calculation formula.
How to add an indicator on the Chart
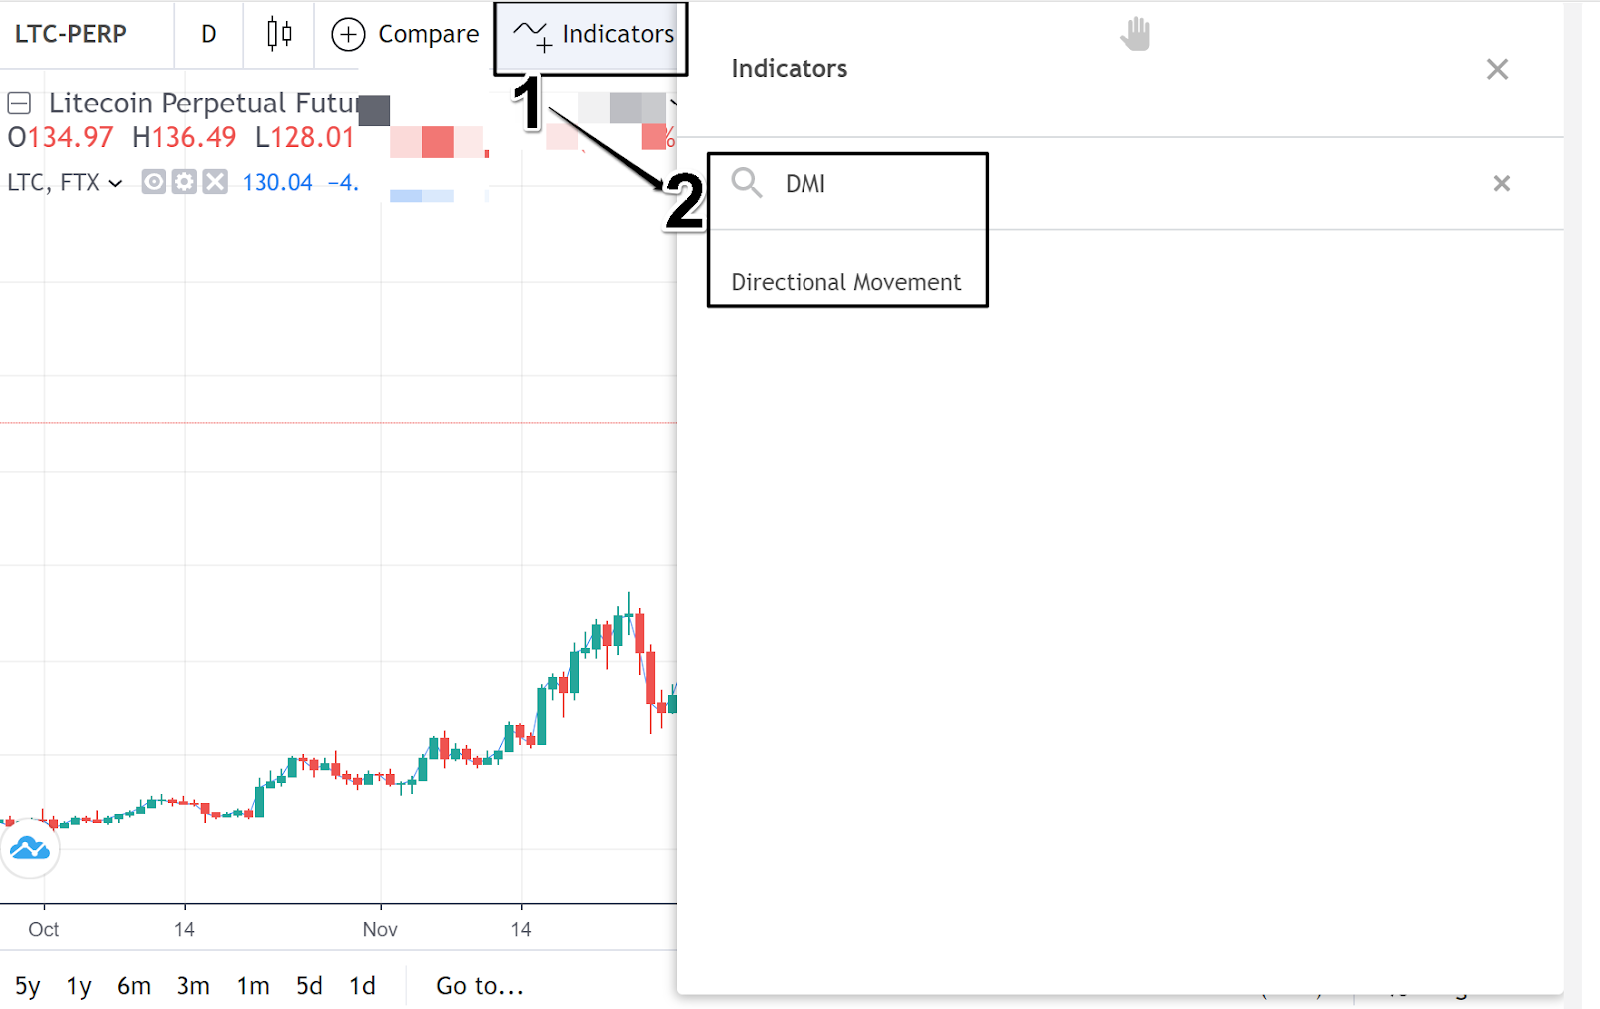
To set the DMI indicator on the FTX, do the following:
- Select indicators or indicators.
- Find the DMI.
- Press select.
How to trade with ADX DMI
Trade with DI+ and -DI
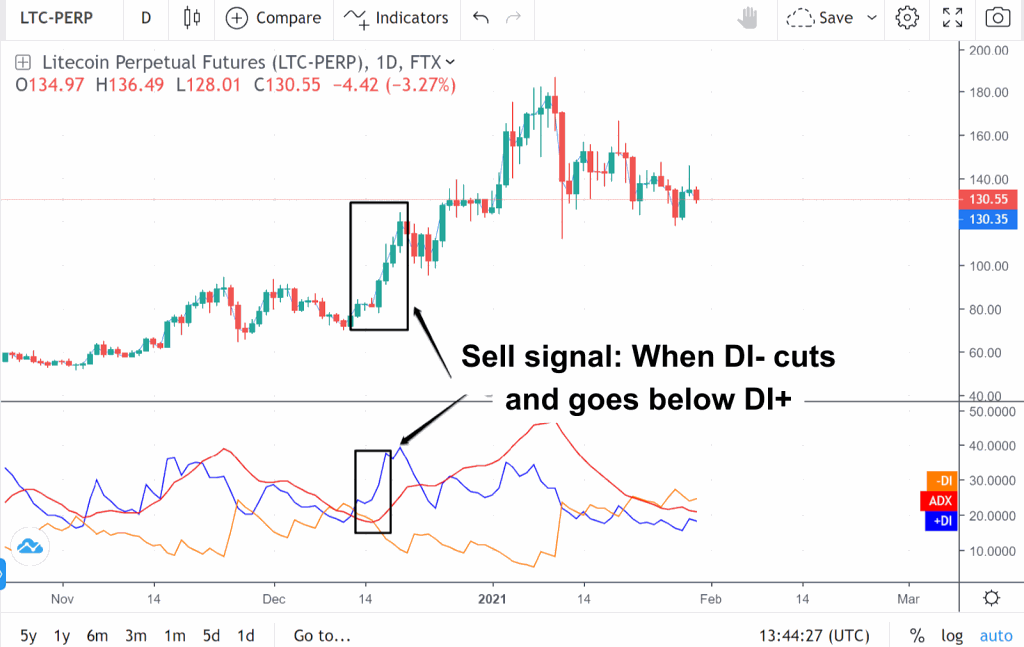
The DMI gives us the following buy and sell signals:
- Buy signal: When DI+ crosses and goes above DI-
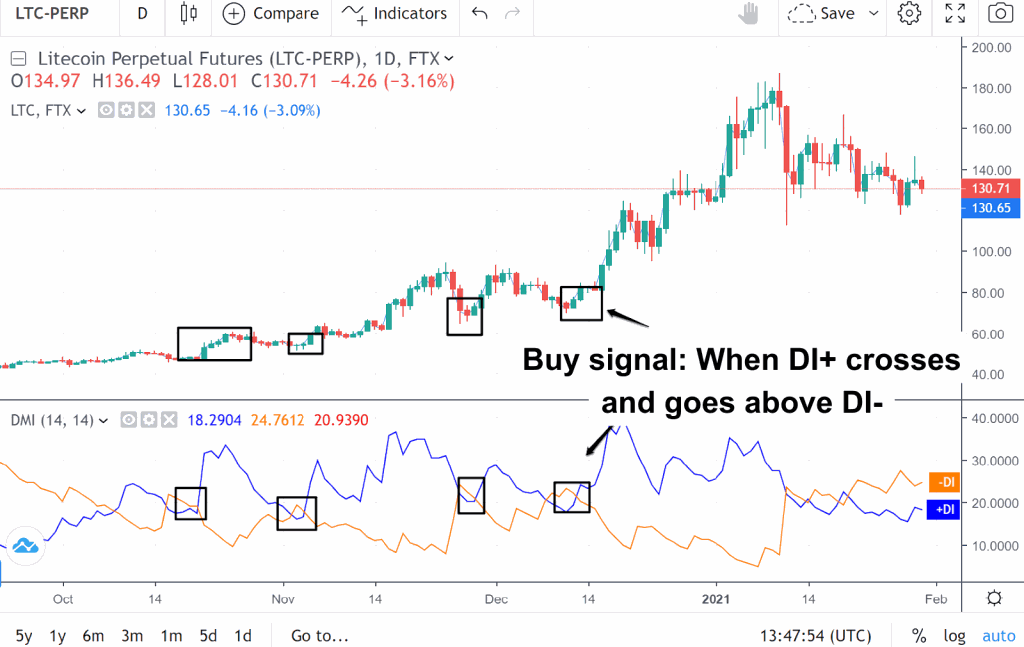
- Sell signal: When DI- cuts and goes below DI+
You need to be careful when using crossovers for trading because they are easily misleading. At this point, you should combine with ADX to accurately determine the current trend.
Used to remove the noise signal of the MA line
Moving averages are highly effective in trending markets. Nevertheless, similar to other indicators, the drawback of utilizing MA arises when the market lacks a distinct trend. During sideways price movements, the MA tends to deliver noisy signals. However, integrating it with the DMI indicator lets you effectively filter out these signals and enhance accuracy.
Combined with RSI, Bollinger Bands, Stochastic
When the market is trending, it is advisable to combine Moving Averages (MA).
When the market lacks a distinct trend, one may consider combining the following indicators: Relative Strength Index (RSI) and Bollinger Bands. This approach allows for trading within a specific price range despite fluctuations.
What should I pay attention to when using the DMI indicator?
The DI+ and DI- lines may intersect continuously; hence it is imperative for investors to exercise caution and consider the ADX line when executing trades. The ADX serves as a representation of the market’s trend strength; thus, discerning investors would prefer to operate within a robust market.
The ADX (Average Directional Index) is an integral directional movement indicator system component. It should be harmonized with the DMI (Directional Movement Index) in order to gauge the strength of the trend indicated by the ADX.
Despite incorporating ADX or not, inherent bias can still manifest in trading activities.
It is important to note that readings and interaction between the DI+ and DI- lines do not encompass all prospective outcomes. Although a crossover may transpire, failure to react appropriately could result in losses.
The crisscrossing of these lines also generates multiple signals without definitively identifying the price trend.
To mitigate this, it is advisable to execute larger trades based on long-term charts or in conjunction with the ADX indicator to isolate strong trends.
Conclude
The Directional Movement Index (DMI) is a versatile technical indicator that helps traders identify trends, trend strength, and potential trading opportunities. By understanding how to interpret DMI signals and employing effective trading strategies like the DMI Crossover, ADX Breakout, or Divergence strategy, traders can increase their chances of success in the dynamic world of financial markets. For optimal results, remember to combine DMI with other technical analysis tools and risk management principles.