

Welcome to our comprehensive guide on technical analysis! Whether you’re new to investing or an experienced trader, understanding technical analysis is essential for making informed decisions in the financial markets. In this blog post, we’ll walk you through the fundamentals of technical analysis and provide practical tips to help you get started. So let’s dive right in!
What is Technical Analysis(TA)?
Technical analysis is a method traders and investors use to evaluate securities based on historical price and volume data. It involves analyzing charts and patterns to identify potential market trends and predict future price movements. Unlike fundamental analysis, which focuses on analyzing company financials and economic factors, technical analysis solely relies on price action.
Key Principles of Technical Analysis
It’s critical to comprehend the following fundamentals in order to effectively include technical analysis in your trading strategy:
Trend Analysis:
Trend analysis forms the foundation of technical analysis. It involves identifying the direction in which a security’s price is moving – upward (bullish), downward (bearish), or sideways (consolidation). By following trends, traders can make more accurate predictions about future price movements.
Support and Resistance Levels:

On a chart, support, and resistance levels are places where the price frequently finds support or experiences selling pressure. These levels are very important in determining where to enter and exit trades. Traders frequently use them as a point of reference when establishing take-profit or stop-loss levels.
Chart Patterns:
Chart patterns are recognizable formations that appear on price charts. They provide insights into potential trend reversals or continuations. Some popular chart patterns include head and shoulders, double tops/bottoms, triangles, and rectangles. Learning how to identify these patterns can help traders anticipate future price movements.
Indicators:
Technical indicators are mathematical calculations applied to price data to generate trading signals. There are various types of indicators, such as moving averages, relative strength index (RSI), stochastic oscillators, and MACD (Moving Average Convergence Divergence). Traders use these indicators to confirm trends, identify overbought or oversold conditions, and spot potential entry or exit points.
Getting Started with Technical Analysis

Now that we’ve covered the basics let’s discuss how you can get started with technical analysis:
Selecting a Trading Platform:
You need access to dependable charting software and current market data in order to execute technical analysis well. Select a trading platform that offers strong charting tools and a broad range of technical indicators. Thinkorswim, TradingView, and MetaTrader are a few well-known systems.
Understanding Different Chart Types:
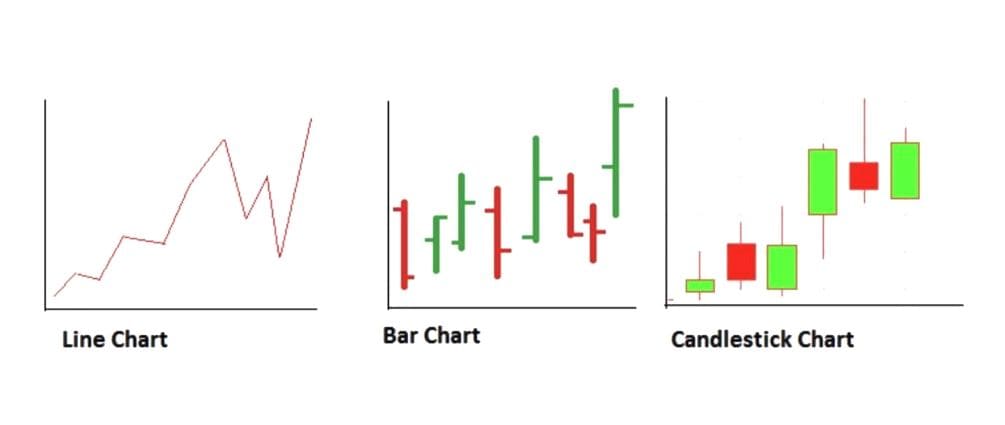
Charts are graphical representations of price movements over time. The most commonly used chart types in technical analysis are line charts, bar charts, and candlestick charts. Each chart type offers unique insights into price action.
- Line Charts: Show the closing prices plotted as a continuous line.
- Bar Charts: Display the high, low, open, and close prices for each period as vertical bars.
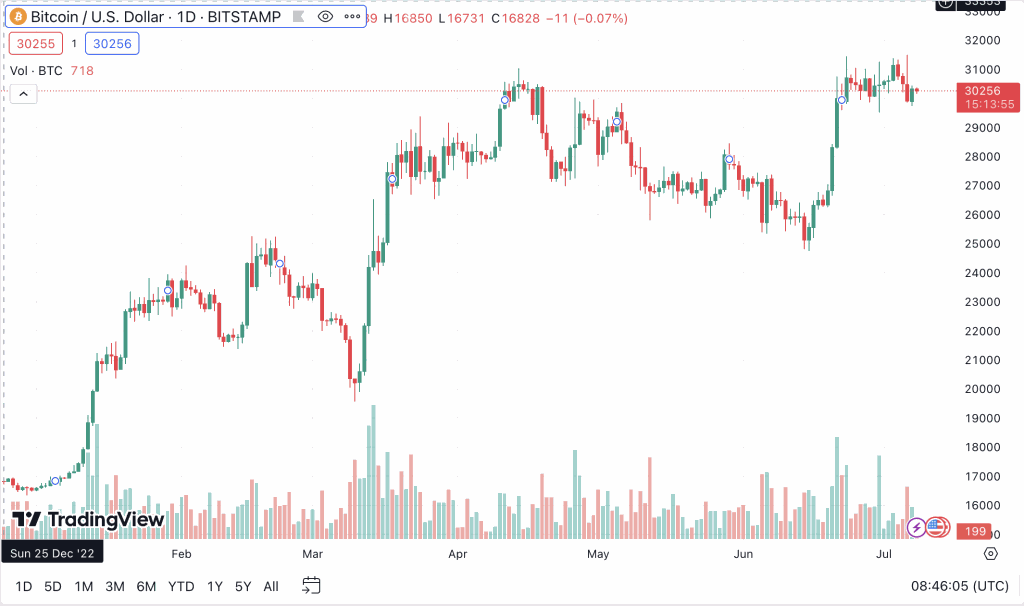
- Candlestick Charts: Present the same information as bar charts but provide visual cues using candlestick patterns.
Learning Key Technical Indicators:
Familiarize yourself with popular technical indicators to better understand price movements. Start by learning about simple moving averages (SMA) and exponential moving averages (EMA). These indicators help smooth out price fluctuations and identify potential trend reversals.
Analyzing Chart Patterns:
Chart patterns provide insightful information about market mood. Recognize typical patterns such as wedges, channels, flags, and pennants. You may make wiser trading selections if you comprehend the traits of these patterns and how they may affect future market behavior.
Applying Technical Analysis in Trading
Now that you have a basic understanding of technical analysis, let’s explore how you can apply it in your trading strategy:
Identify the Trend:
The first step is to identify the overall trend. Use moving averages or trendlines to determine if the market is in an uptrend, downtrend, or sideways movement. Trading with the trend increases your chances of success.
Confirm with Indicators:
Once you’ve identified the trend, use technical indicators to confirm it. For example, if the market is in an uptrend, look for bullish indicators like rising RSI or MACD crossovers. Conversely, if the market is a downtrend, seek bearish signals such as falling RSI or negative MACD divergence.
Set Entry and Exit Points:
Support and resistance levels are crucial in determining entry and exit points for trades. Set your entry point near support in an uptrend and near resistance in a downtrend. Likewise, establish your exit point by placing stop-loss orders below support or above resistance levels.
Monitor Price Patterns:
Keep a close eye on chart patterns that may signal potential reversals or continuations of trends. These patterns can be used to fine-tune your entry and exit points. For instance, if you spot a double-top pattern forming during an uptrend, consider selling your position.
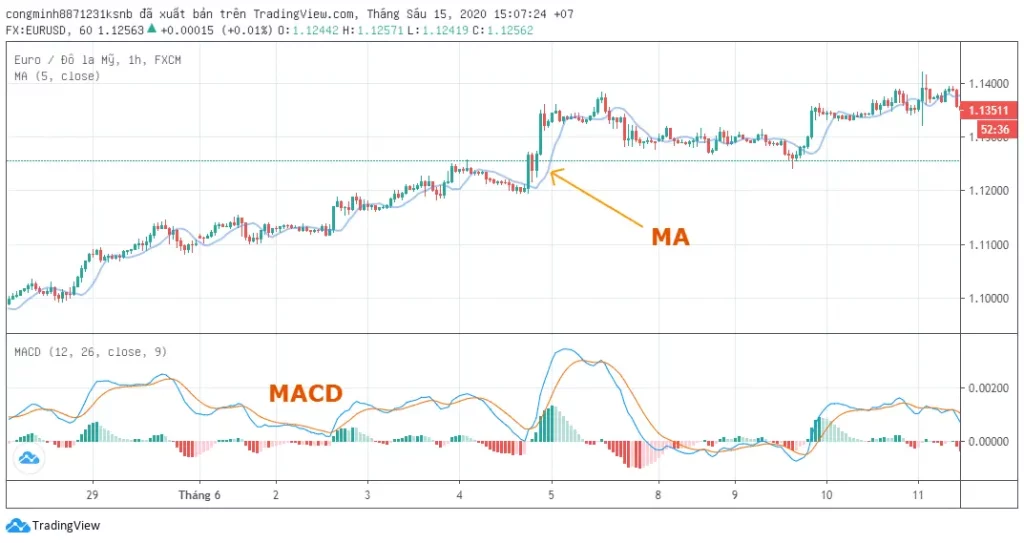
Technical analysts use indicators to predict future price movements by analyzing past price data. Such indicators include:
- The trend indicator relates to the lag, which measures the strength and direction of the trend. A trend is considered bullish when the price moves above the average. When the price moves below average, it is considered a downtrend. Namely, moving averages (MAs), and moving averages converging divergences (MACDs).
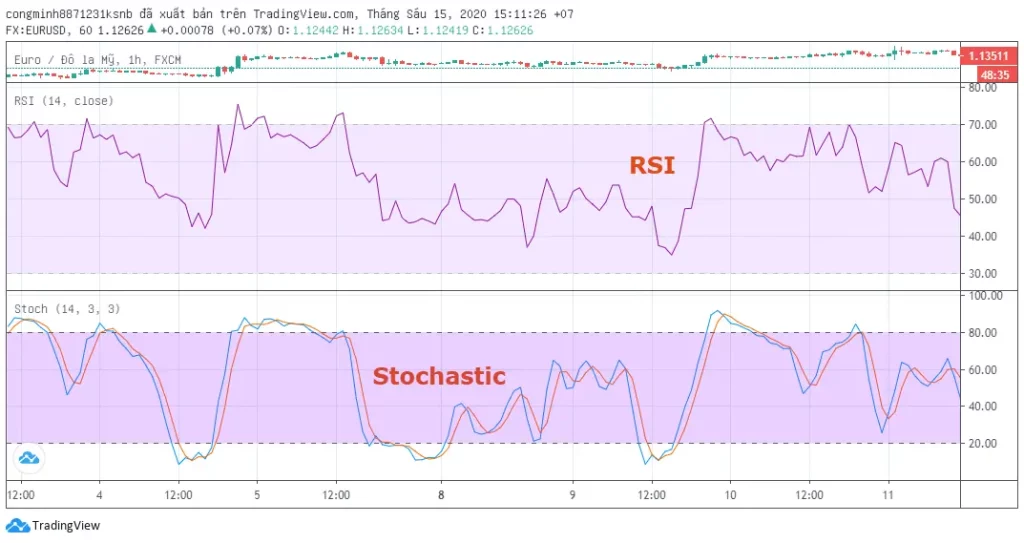
- Early indicator helps determine the speed and volume of price movements by comparing prices over time. This type talks about the Stochastic indicator, the relative strength indicator (RSI).
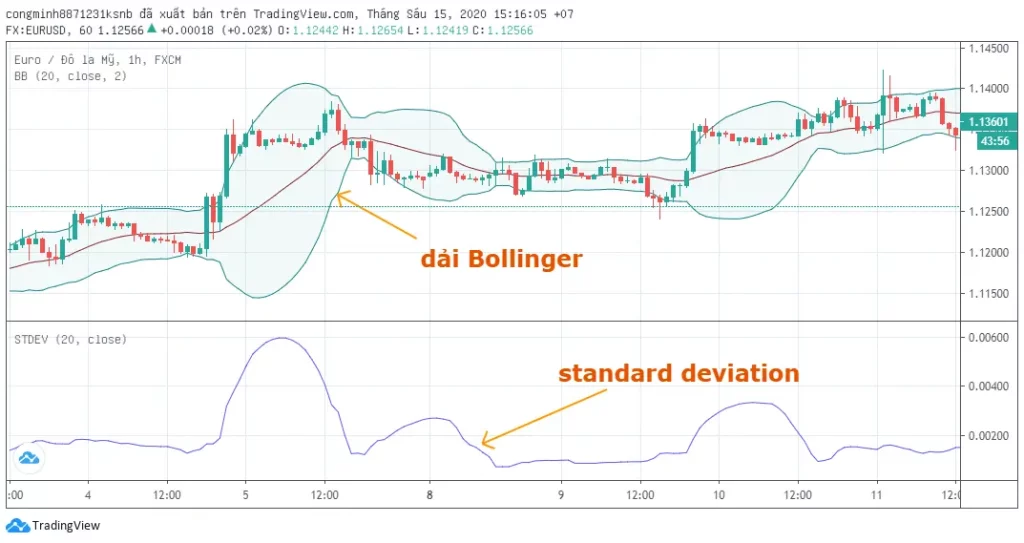
- The index measures the rate of price movement based on historical highs and lows. These are Bollinger bands and standard deviation indicators.
Limitations of Technical Analysis
While technical analysis has proven to be a valuable tool for many traders, it’s important to acknowledge its limitations:
Market Volatility:
Technical analysis makes forecasts regarding future price movements based on historical price data. Price movement may diverge from expected patterns during times of high volatility or unexpected news developments, making them less dependable.
Subjectivity:
Chart interpretation and pattern recognition involve considerable subjectivity. Depending on their background and biases, various traders may interpret the same chart differently. It’s essential to practice good judgment and get experience.
Time-Consuming:
Technical analysis can take a lot of time, particularly for traders who use a variety of indicators and chart patterns. It necessitates constant observation of price movement and revision of your analysis when fresh information becomes available.
Conclusion:
Congratulations! Now that you’ve learned about the interesting field of technical analysis. Keep in mind that practice and time are required to acquire this talent. Explore various chart types, indicators, and chart patterns after first grasping the fundamental ideas we covered, then progressively incorporate them into your trading strategy.
To make wise investing decisions, always mix technical analysis with other types of analysis, such as fundamental analysis. Maintain discipline, limit your exposure to risk, and keep learning to hone your trading abilities. Happy research!