
The Bolinger bands are essential indicators in determining trends and price zones in technical analysis. In this article, let’s learn Bolinger bands and how to apply them in technical analysis.
What is a Bollinger Band
A Bollinger Band is a technical analysis tool comprising a series of trendlines. They are plotted as two standard deviations away from a security’s price, both positively and negatively, and can be changed to user preferences.
Bollinger Bands were created by technical trader John Bollinger and are intended to help investors detect whether an asset is oversold or overbought.
How to Calculate Bollinger Bands
The first step in calculating the Bollinger Bands is to find the simple moving average.

The upper and lower Bollinger Bands are calculated by determining a simple moving average and then adding/subtracting a specified number of standard deviations from the simple moving average to calculate the upper and lower bands.
In the above formulas, D represents the number of standard deviations applied to the Bollinger Bands indicator.
How does this indication work?
When the bands narrow during a period of low volatility, the probability of a sharp price move in either direction increases. This could be the start of a trend. Keep an eye out for a false move in the opposite way that reverses before the actual trend begins.
When the bands separate considerably, volatility rises, and any current trend may end.
Prices tend to bounce within the envelopes of the bands, touching one round and then transferring to the other. These swings can be used to help you discover potential profit objectives. For instance, the top band becomes the profit objective if a price bounces off the lower band before crossing above the moving average.
During strong trends, prices might surpass or hug a band envelope for extended periods. If your momentum oscillator diverges, you should do more study to see if taking additional profits is a good idea for you.
A significant trend continuation is likely when the price breaks out of the bands. However, the predicted strength is eliminated if prices instantly return to within the band.
What Do Bollinger Bands Tell You?
Bollinger Bands is a well-known strategy. Many traders feel that as prices move closer to the upper band, the market becomes more overbought, and as prices move closer to the lower band, the market becomes more oversold. When employing the bands as a trading technique, John Bollinger has a set of 22 guidelines to follow.
The Squeeze
Bollinger Bands are based on the “squeeze” idea. A squeeze occurs when the bands come close together, compressing the moving average. A squeeze indicates a time of low volatility and is regarded by traders as a probable indicator of future rising volatility and trading opportunities.
In contrast, the wider the bands move apart, the greater the likelihood of a drop in volatility and the greater the potential of abandoning a trade. These are not trading circumstances. The bands do not indicate when the price will change or in which direction it will move.
Breakouts
Approximately 90% of price movement takes place between the two bands.1 Any break above or below the bands is noteworthy. The breakout is not a trading signal, and many investors interpret it as such when the price hits or exceeds one of the bands. Breakouts do not indicate the direction or magnitude of future price movement.
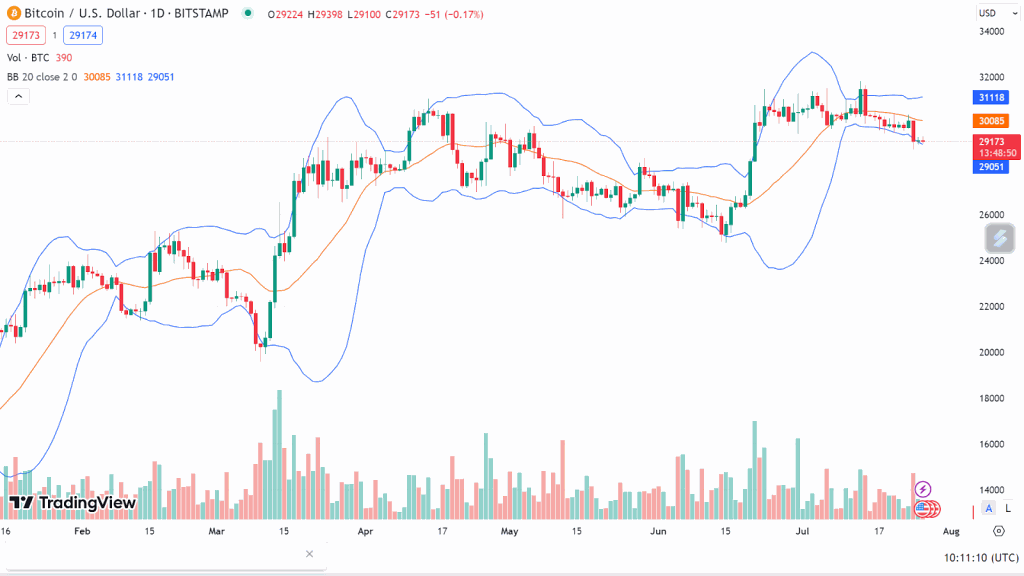
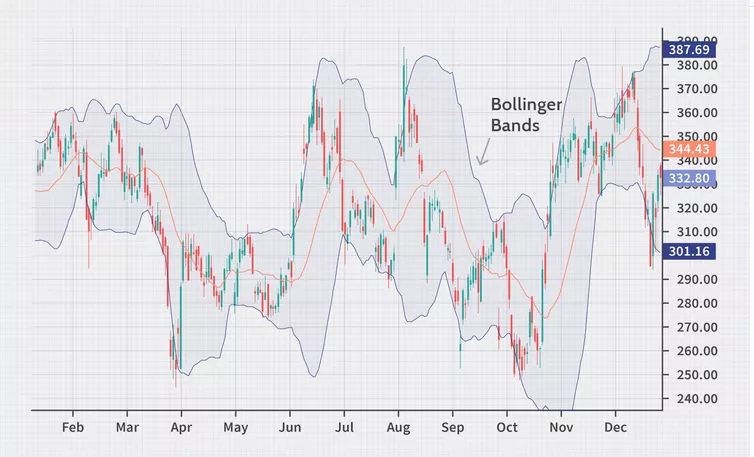
Example of Bollinger Bands
Bollinger Bands are used in the chart below to frame the stock’s 20-day SMA with an upper and lower band and the stock’s daily price moves. Because standard deviation is a measure of volatility, the bands expand when markets become more volatile; when markets become less volatile, the bands contract.
Bollinger Bands’ Limitations
Although Bollinger Bands are useful tools for technical traders, they have some restrictions that should be considered before using them. One of these disadvantages is that the Bollinger Bands are primarily reactive rather than predictive.
The bands will react to price movement changes, either uptrends or downtrends, but will not predict price movements. Bollinger Bands are a lagging indicator, as are other technical indicators.
This is the explanation because the tool is based on a simple moving average, which takes the average price of numerous price bars.
Bollinger Bands FAQs
Which Indicators Complement Bollinger Bands the Best?
Many technical indicators perform better when combined with others. Bollinger Bands are frequently used in conjunction with the relative strength indicator (RSI) and the BandWidth indicator, which measures the width of the bands relative to the central band. Traders use bandwidth to identify Bollinger Squeezes.
How Reliable Are Bollinger Bands?
Because Bollinger Bands are set to +/- two standard deviations around an SMA, we may expect the observed price action to fall within these bands 95% of the time.
What Time Frame Is Ideal for Using Bollinger Bands?
Bollinger Bands are commonly calculated using a 20-day moving average.
Conclusion
Bollinger Bands can be helpful for traders in measuring a stock’s relative level of over- or under-sold position and guiding on when to enter and exit a position. Certain Bollinger Bands features, such as the squeeze, are helpful for currency trading. Buying when stock prices cross below the lower Bollinger Band might help traders profit from oversold conditions when the stock price climbs back toward the center moving-average line.