
Japanese candlestick patterns are a popular and effective tool in technical analysis to predict price trends in financial markets. Originally developed by Japanese rice traders in the 18th century, this charting method has gained worldwide recognition for providing valuable insights into market sentiment and potential future price movements. In this blog post, we will explore Japanese candlestick patterns, how they work, and how you can use them to predict price trends.
Understanding Japanese Candlestick Patterns
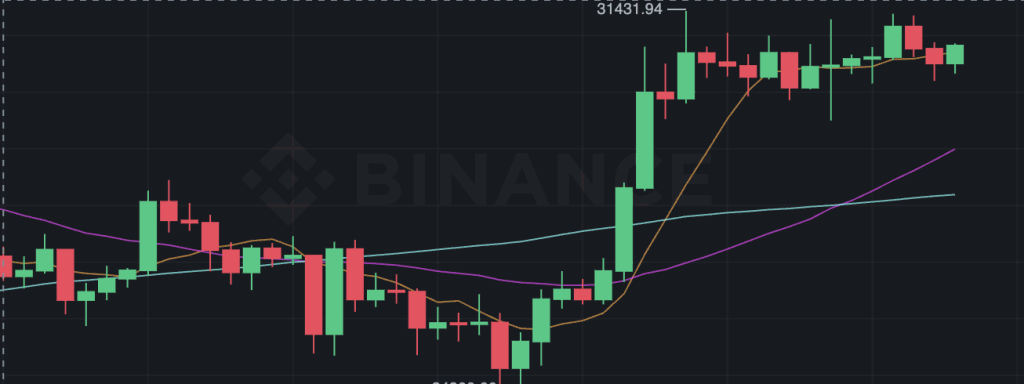
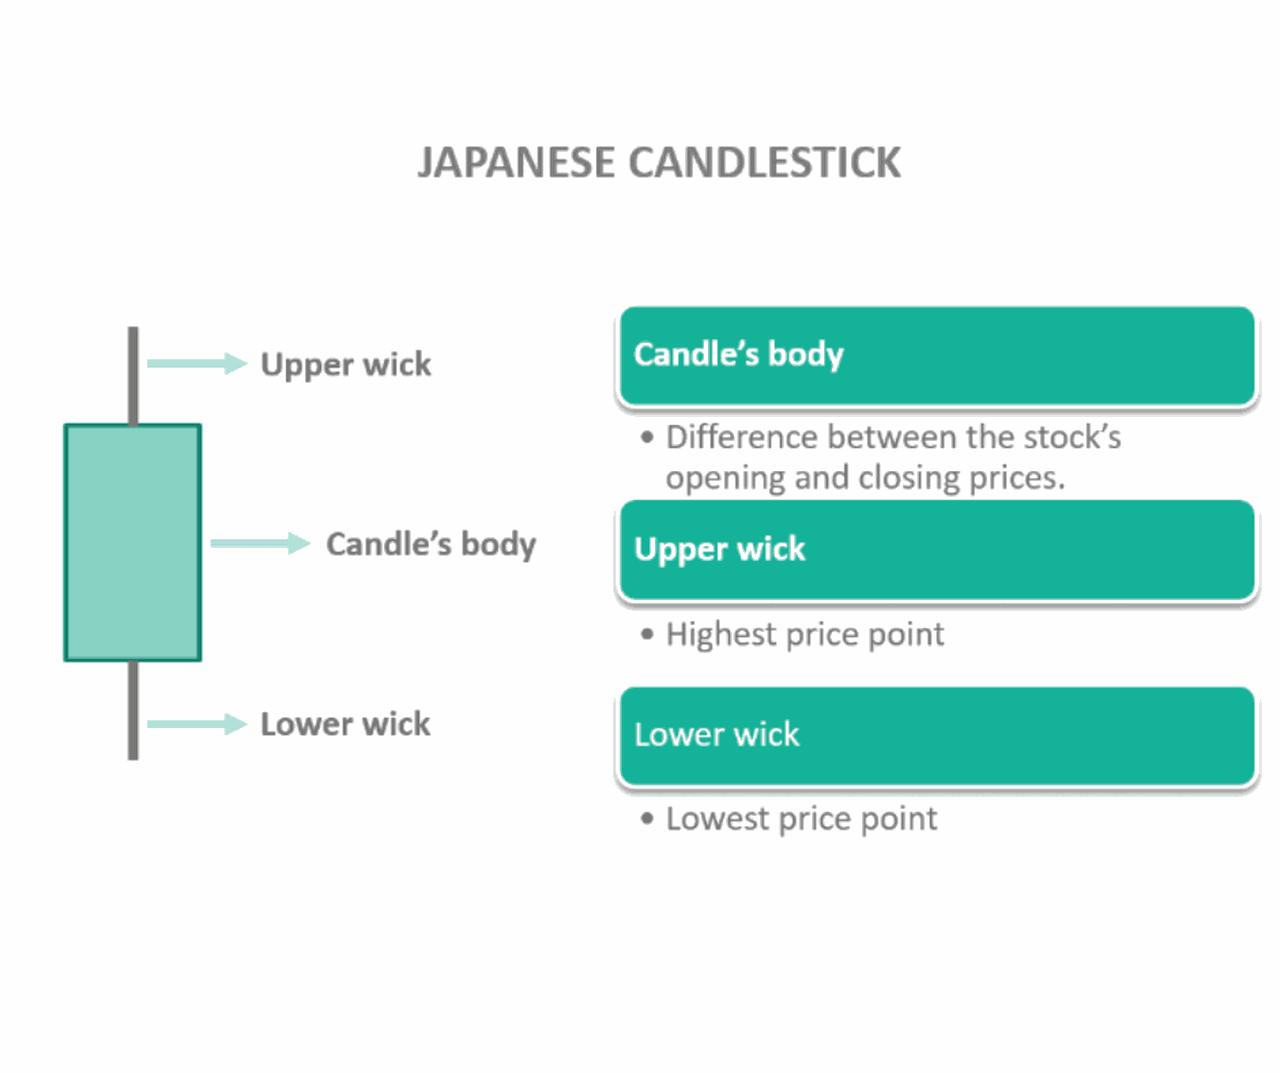
Japanese candlestick patterns are a visual representation of price movements over a specific period. Each candlestick on the chart displays the period’s opening, closing, high, and low prices. The candle’s body represents the range between the opening and closing prices, while the wicks or shadows indicate how far the price moved above or below this range.
Candlesticks come in different shapes and sizes, each with its own meaning. Common candlestick patterns include doji, hammer, engulfing pattern, shooting star, and spinning top. By studying these patterns and their formations on a chart, traders can gain insights into market psychology and make informed decisions about buying or selling assets.
The Basic Candlestick Patterns
Doji Pattern
The doji pattern is characterized by a small body with equal or nearly equal open and closed prices. This formation indicates indecision in the market as buyers and sellers are evenly matched. Traders often interpret a doji pattern as a potential reversal signal if it occurs after an extended trend.

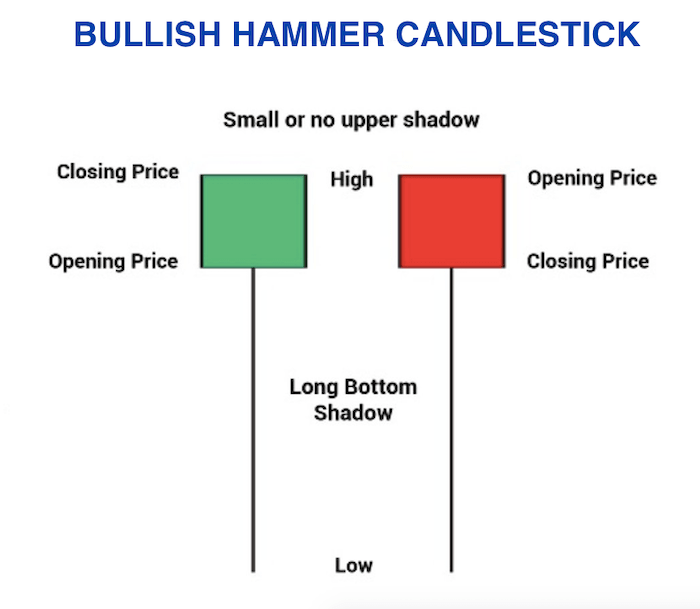
Hammer Pattern
The hammer pattern has a small body at the upper end of the candle’s range with a long lower shadow or wick. It signals that despite bearish pressure during the trading session, buyers managed to push the price back up. The hammer pattern is considered a bullish reversal signal, especially when it appears after a downtrend.
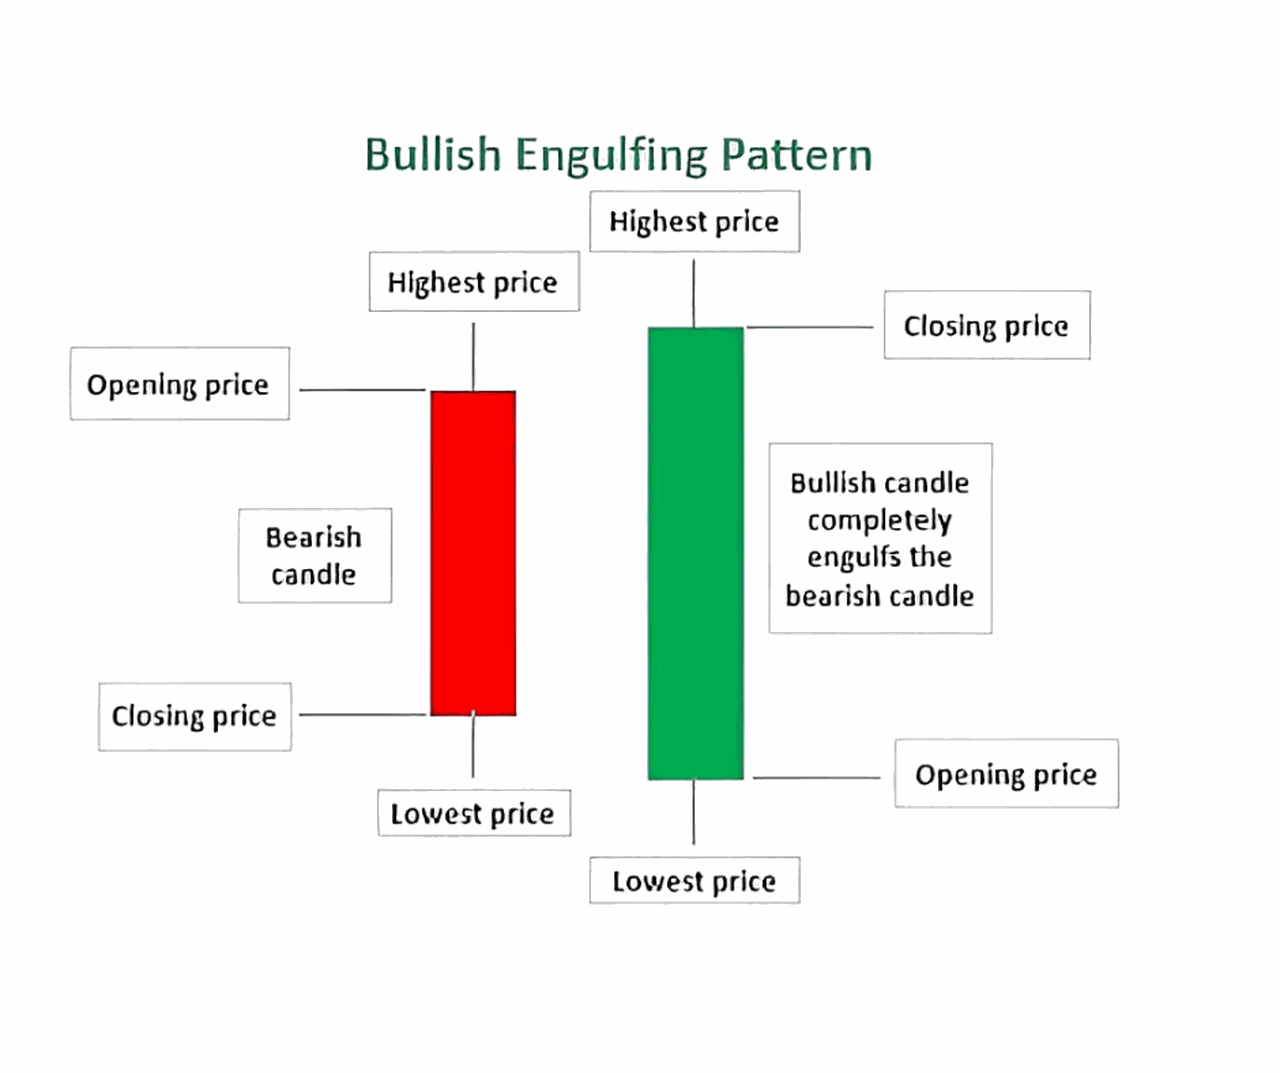
Engulfing Pattern
The engulfing pattern consists of two candles where the second candle completely engulfs the first candle’s body. A bullish engulfing pattern occurs when a small bearish candle is followed by a larger bullish candle, indicating a potential upward reversal. On the other hand, a bearish engulfing pattern suggests a possible downward trend reversal.
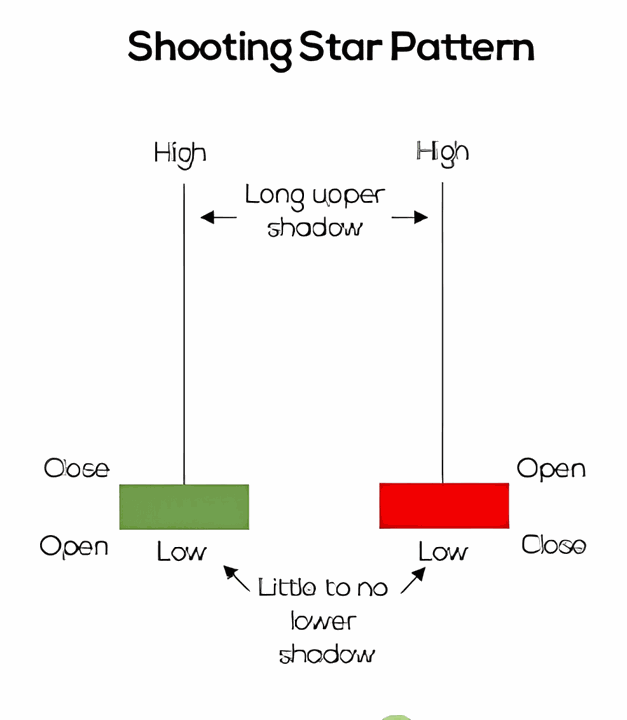
Shooting Star Pattern
The shooting star pattern has a small body at the lower end of the price range with a long upper shadow or wick. It indicates that despite bullish pressure during the session, sellers managed to push the price back down. The shooting star pattern often serves as a bearish reversal signal, especially when it forms after an uptrend.
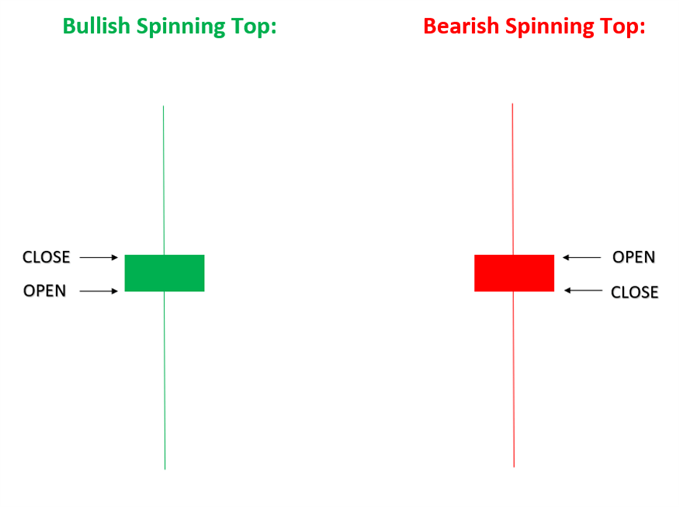
Spinning Top Pattern
A spinning top pattern occurs when the candlestick has a small body and long upper and lower shadows or wicks. This formation suggests indecision in the market as buyers and sellers struggle to gain control. Traders often interpret spinning tops as neutral patterns that may indicate a potential trend reversal or continuation depending on their context within the chart.
How to Use Japanese Candlestick Patterns for Price Trend Prediction
Using Japanese candlestick patterns for price trend prediction involves identifying specific formations on charts and understanding their implications. Here are some steps you can follow:
- Familiarize Yourself with Candlestick Patterns: Learn about different candlestick patterns, their names, and what they signify regarding market sentiment and potential future price movements.
- Study Historical Charts: Analyze historical charts of different financial assets using candlestick patterns to identify recurring patterns and their correlations with price trends.
- Combine Candlesticks with Other Technical Indicators: To increase the accuracy of your predictions, consider combining candlestick analysis with other technical indicators such as moving averages, volume, and trendlines.
- Identify Relevant Candlestick Patterns: Look for candlestick patterns relevant to the asset you’re analyzing and your working timeframe. Different patterns may have different implications depending on these factors.
- Confirm Signals with Volume: Pay attention to volume levels when analyzing candlestick patterns. High trading volumes accompanying certain patterns can further confirm potential trend reversals or continuations.
- Consider Market Context: Consider the broader market context, including news events, economic indicators, and overall market sentiment, when interpreting candlestick patterns. These external factors can influence price trends and validate or invalidate certain patterns.
- Practice Risk Management: Implement proper risk management strategies such as setting stop-loss orders and calculating risk-to-reward ratios to protect your investments when using candlestick patterns for price trend prediction.
Advantages of Using Japanese Candlestick Patterns
Japanese candlestick patterns offer several advantages over other methods of technical analysis. Some of these advantages include:
- Easy Interpretation: Candlestick charts visually represent price movements, making them easier to interpret compared to complex mathematical models or indicators.
- Clear Price Levels: Candlesticks clearly indicate important price levels, such as support and resistance areas, helping traders make informed decisions about entry and exit points.
- Ability to Identify Reversal Points: Candlestick patterns often signal potential trend reversals, allowing traders to capitalize on profitable opportunities by entering or exiting positions at the right time.
- Identification of Market Sentiment: The shapes and formations of candlesticks reflect market sentiment, giving traders insights into whether buyers or sellers are in control at a given time.
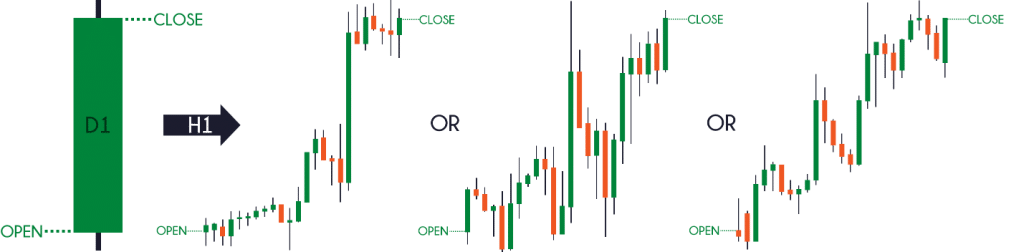
- Compatibility with Multiple Timeframes: Candlestick analysis can be applied to various timeframes, from minutes to months, making it suitable for both short-term traders and long-term investors.
Limitations of Japanese Candlestick Patterns
While Japanese candlestick patterns are a valuable tool, it’s important to recognize their limitations. Some of these limitations include:
- Subjectivity: Interpretation of candlestick patterns can be subjective, as different traders may assign different meanings or significance to the same pattern.
- False Signals: Like any technical indicator or method, candlestick patterns are not infallible and can sometimes generate false signals. Traders should use additional confirmation tools to reduce the risk of false predictions.
- Lack of Predictive Power in Isolation: Relying solely on candlestick patterns without considering other technical indicators or fundamental analysis may limit the accuracy of price trend predictions.
- Market Noise: In volatile markets with high levels of noise, it can be challenging to distinguish meaningful candlestick patterns from random fluctuations.
- Limited Application to Certain Assets: Candlestick patterns may not work as effectively for all types of financial assets or markets. Each asset class has its own unique characteristics that may require additional analysis methods.
Conclusion
Japanese candlestick patterns are a powerful tool for predicting price trends in financial markets. By understanding the different formations and their implications, traders can gain valuable insights into market sentiment and make informed decisions about buying or selling assets. However, it’s important to remember that while candlesticks provide valuable information, they should not be used in isolation but rather in conjunction with other technical indicators and fundamental analysis for more accurate predictions.