
What Is the Elliott Wave Theory?
In technical analysis, the Elliott Wave Theory describes price movements in the financial market. Ralph Nelson Elliott developed it and looked for reoccurring fractal wave patterns in stock price movements and customer behavior. Riders on a wave are investors who profit from a market movement.
History of Elliott Wave Theory
Ralph Nelson Elliott developed the theory in the 1930s. However, it was popularized in the 1970s by Robert Prechter. It contends that the patterns and trends seen in the markets result from crowd behavior.
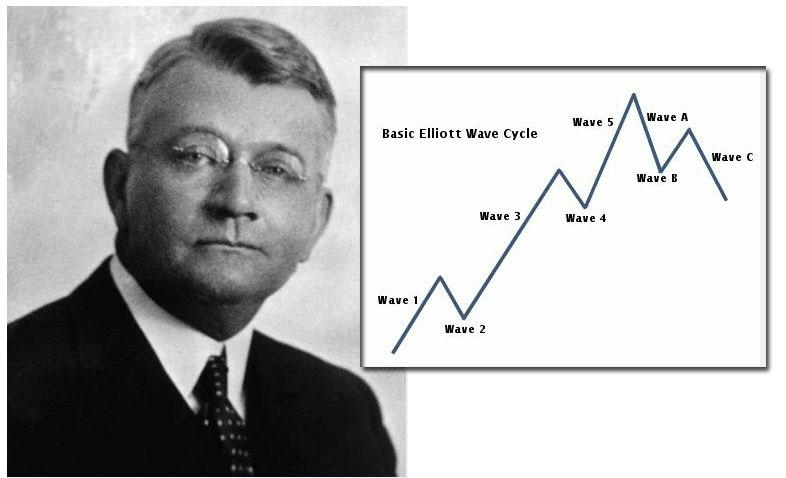
Elliott concluded that stock market movements can be forecast by monitoring and analyzing recurrent wave patterns. Elliott Wave was able to do a more in-depth analysis of the market. Determine precise wave pattern characteristics and produce thorough market forecasts.
How Elliott Waves Work
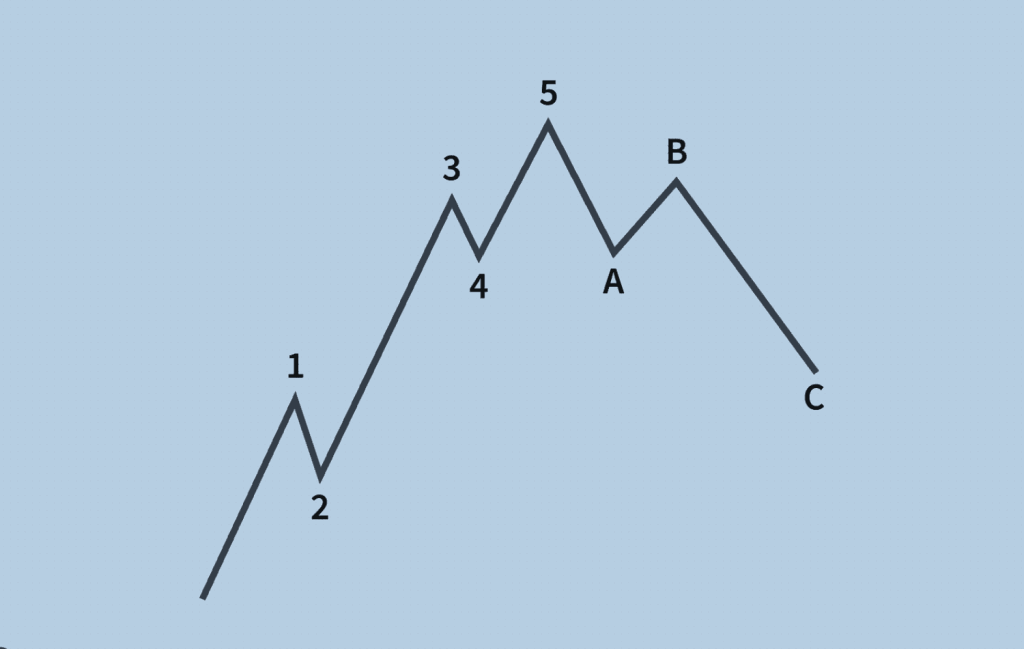
Certain technical analysts use the Elliott Wave Theory to profit from stock market wave patterns. According to the theory, stock price changes may be forecast because they move in repeating up-and-down patterns called waves, which are caused by investor psychology or mood.
The idea is subjective and divides waves into motive or impulse waves and corrective waves. Wave analysis does not imply a set of instructions to follow. Wave analysis provides insights into trend dynamics and assists investors in comprehending price changes.
To build larger patterns, impulse, and corrective waves are nested in a self-similar fractal. A one-year chart, for example, may be amid a corrective wave, while a 30-day chart may suggest a growing impulse wave. This Elliott wave interpretation may provide a trader with a long-term gloomy perspective with a short-term optimistic outlook.
Impulse Waves
Impulse waves are made up of five sub-waves that move in the same direction as the next-largest degree’s trend. This is the most typical motive wave and the most straightforward market identification. It is made up of five sub-waves, three of which are motive waves. Two of these are corrective waves.
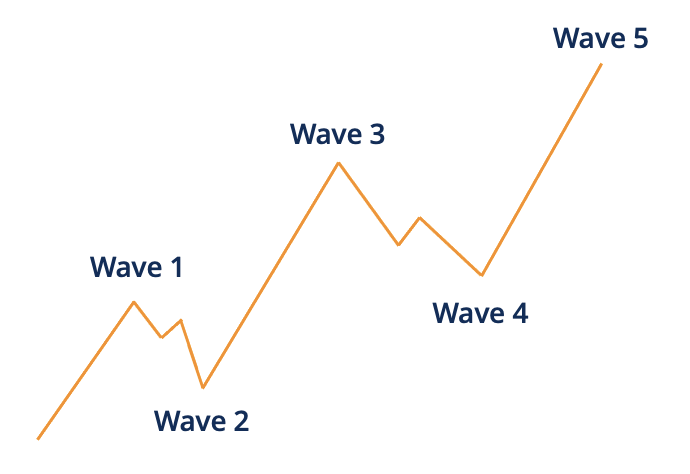
Structured as a 5-3-5-3-5 pattern:
– The second wave cannot retrace more than 100% of the first wave.
– The third wave will never be the shortest. 1, 3, and 5
– Wave 4 can never go beyond the third wave.
If one of the rules is broken, the structure is no longer an impulse wave. The trader would have to redo the labeling of the suspected impulse wave.
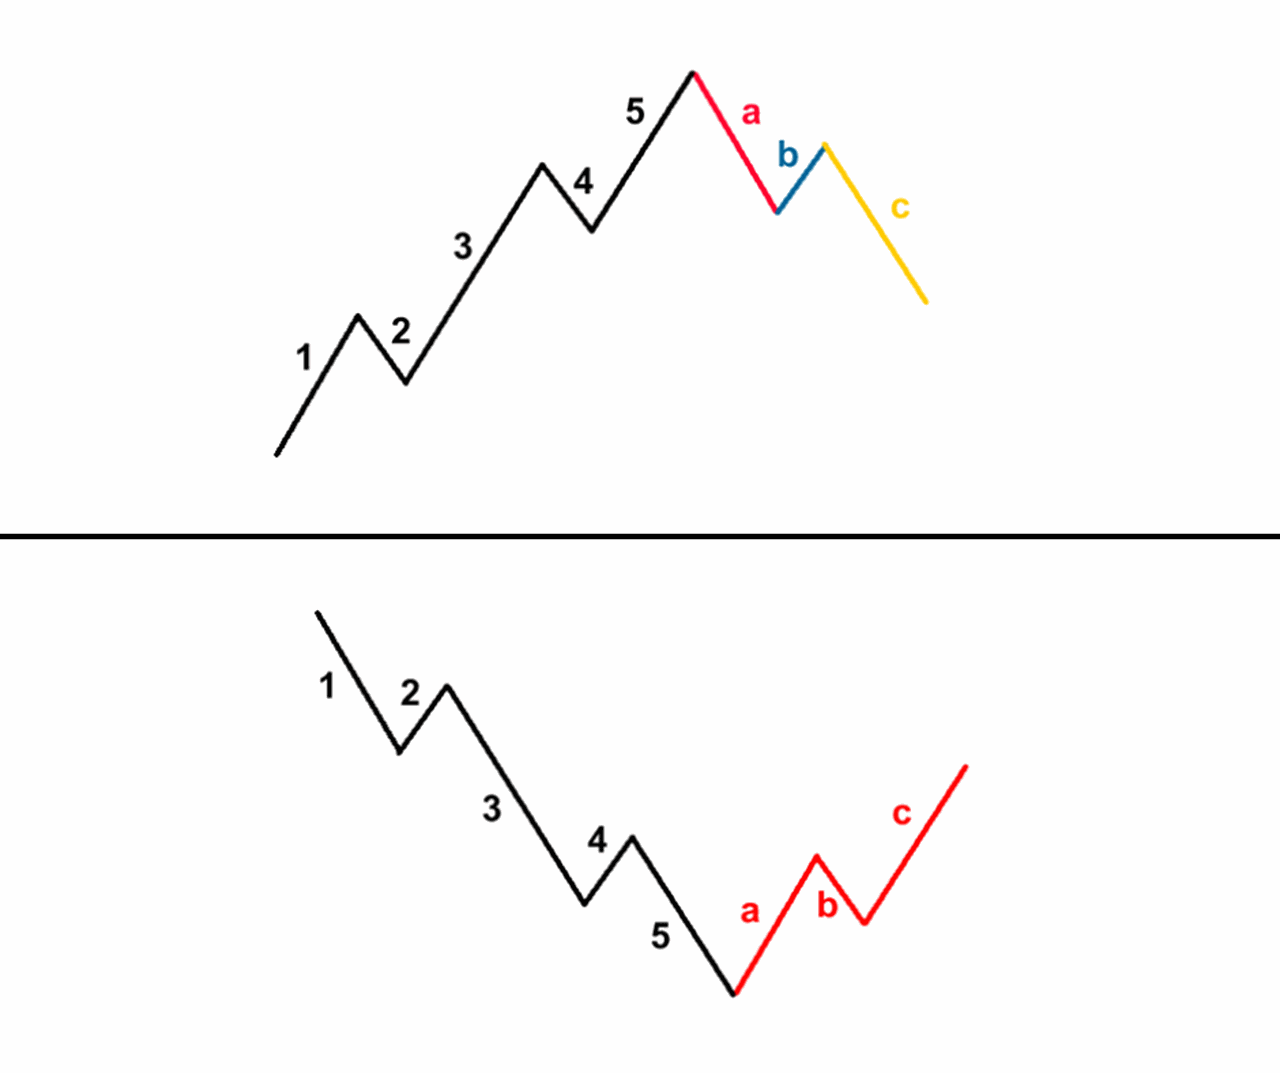
Corrective Waves
Corrective waves, also known as diagonal waves, are made up of three sub-waves that move in the opposite direction to the trend of the next-largest degree. Its purpose is to move the market in the trend’s direction.
– The corrective wave is made up of five sub-waves.
– The diagonal appears to be an extending or contracting wedge.
– Depending on the type of diagonal being examined, the sub-waves may not have a count of five.
– Each diagonal sub-wave never completely retraces the previous sub-wave; therefore, diagonal sub-wave 3 may not be the shortest wave.
Elliott Wave FAQs
Other Indicators vs. Elliot Wave Theory
Elliott discovered that the Fibonacci sequence represents the number of waves in impulses and corrections. Price and time wave interactions frequently reflect Fibonacci ratios, such as 38% and 62%. A corrective wave, for example, may retrace 38% of the preceding impulse.
Other analysts, such as the Elliott Wave Oscillator Chart, have created indicators based on the Elliott Wave theory. Based on the difference between a five-period and a 34-period moving average, the oscillator gives a computerized technique for predicting future price direction. Elliott Wave International’s artificial intelligence system, EWAVES, generates automatic Elliott wave analysis by applying all Elliott wave principles and standards to data.
Elliott Wave is the best for trading.
Looking at a wave cycle, it can be seen that wave 3 is the most extended, so it is considered an opportunity wave for trading. So is wave 5; these are two Elliott waves forming a trend line.
But let’s not forget that the move that creates the trend can cause a correction. However, it is also possible to trade while in a correction, but it is more complex, and the profit-making is also considered more minor.
Elliott’s wave trading strategy is highly effective.
Consider tracking each wave in the overall price structure. Taking the Elliott wave theory, after a 5-wave pattern moves up, a more extensive three-wave correction usually follows.
Watching the direction of the correction will signal a potential trend change, which is more robust if combined with a 5-wave pattern or the end of a 3-wave sentence.
Elliott Wave is not a trading technique. There are no specific rules for entering and exiting orders. There is also no correct way to use it in a transaction. Therefore, many traders and technical analysts have avoided the use of Elliott waves.
If you do Elliott wave analysis, you will do wave counting. This means symbolizing the waves to see which Elliott wave pattern they match. Thereby allowing you to predict the movement of the market.
However, success is not limited to the Elliott wave theory alone. A combination of other methods will help a lot.
Fibonacci is an example; this is the perfect combination and scientific nature. The side of the Elliott wave helps to form the frame. On the other hand, the Fibonacci side will bring its tool to measure price movements. And there are many more combinations I will gradually introduce to you, but in general, if you make a profit, combine.
In conclusion
Ralph Nelson Elliott invented the Elliott Wave Theory. It offers a technical study of price trends about shifts in investor mood and psychology. The theory distinguishes between impulse waves, which build a pattern, and corrective waves, which resist the greater tendency. It assumes that stock price fluctuations may be forecast since they follow a pattern of ups and downs.