
What is Fibonacci?
Fibonacci is an indicator used in technical analysis created from the basis of the series of numbers and the Fibonacci coefficients of the mathematician Leonardo Fibonacci.
There is a lot of research related to the concept of Fibonacci. But in the field of application to trading forex, cryptocurrencies,… or in general, what we will discuss includes Fibonacci retracement and Fibonacci extension.
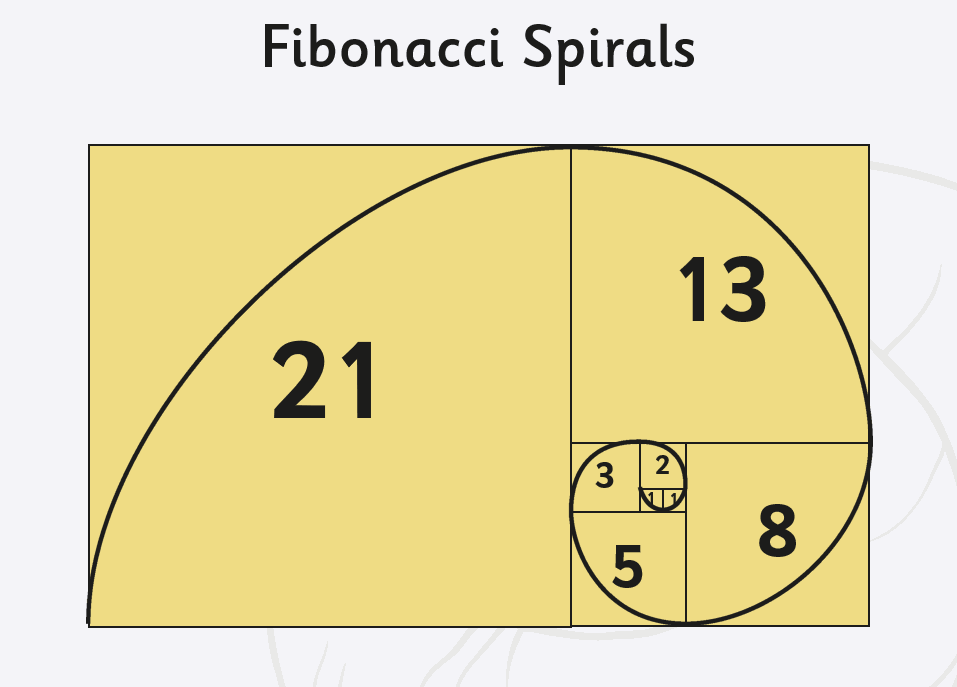
The Fibonacci sequence comprises numbers from the natural numbers starting at 0 and 1 or 1 and 1. The following elements are equal to the two before it, which adds up to a sequence like this: 0, 1, 2, 3, 5, 8, 13, 21, 34, 55, 89, 144,…
Fibonacci and the golden ratio
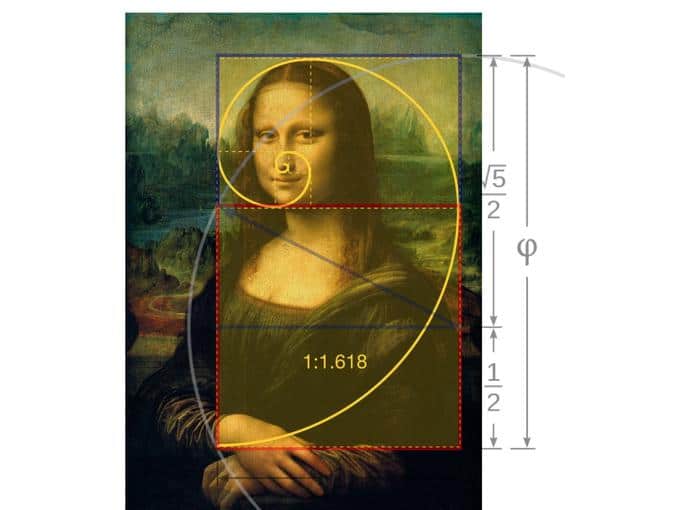
Any number in the sequence divided by the previous number yields a constant of ~1.618. This is a constant that is found to be repeated as a rule. For example, 55*C=89 and 89*C=144. This is called the golden ratio.
A real-life example: the forearm and hand are also in the golden ratio. Or image of Mona Lisa
After researching and applying, traders have found a rule that we can use the Fibonacci sequence to find support and resistance points or set up our trading system.
The most commonly used ratios: 0.236, 0.382, 0.5, 0.618, 0.786 ( or 0.764), 1.
Now we will study the Fibonacci sequence’s relationships, including retracement and extension.
Fibonacci retracement
Fibonacci retracement is the most widely used among all the Fibonacci trading tools.
Uses
Some people call it a regression (English name: Fibonacci retracement). Fibonacci retracement is used to find potential support points that can occur when the market drops from top to bottom.
Conversely, if the market bounces back from bottom to top, use it to find potential resistance points. The Fibonacci retracement levels include 0.236, 0.382, 0.618, and 0.764.
How to use Fibonacci retracement
The Fibonacci indicator will be applied most effectively when a market has a clear trend.
Identify Fibonacci retracement in an uptrend
- Determine the highest point in your trading timeframe.
- Determine the lowest points from the highest point just determined at the beginning.
- Drag the Fibonacci retracement from the top to the bottom in turn.

An example of making a profit with it is as below. You will perform the following identification steps:
- The highest score is set at 89.83. The bottom at the start of the uptrend reversal is 71.31.
- Pulling from the top to the bottom will have five identified support levels: 0.236, 0.382, 0.5, 0.618, and 0.764.
- You would now wish that when the price of that asset drops from the top, to meet support at those Fibonacci levels. Then most traders will place buy orders when the price retraces at that level.
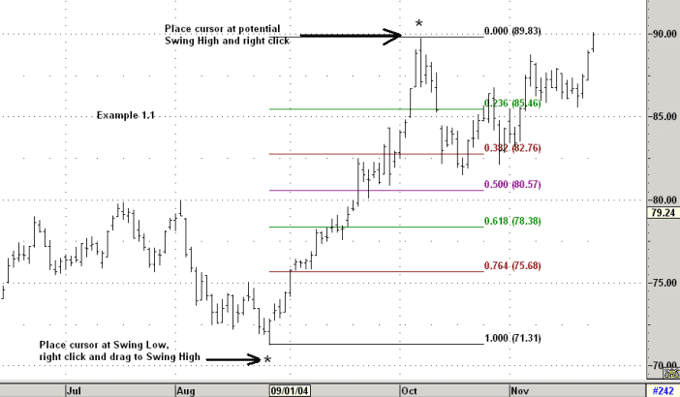
Consider in detail the strength and weakness of the fibo levels: 0.236 (weak), 0.382 (medium), 0.5 (strong). From there, the transaction can be made as follows:
- The 0.236 Fibo level is weak; the price moves straight through without a hitch.
- The 0.382 level was considered to support, and the price returned to test the 0.236 level above. Still unable to break through 0.236 and the price to test 0.382.
- After that, the price reversed right at the strong 0.5 Fibo level. And finally, you can place buy orders around 0.5 for each correction.
Same if in a downtrend.
Evaluate the pros and cons of the Fibonacci retracement
Although the popularity of Fibonacci retracement is undisputed. However, there are still downsides that you need to pay attention to.
Advantages
- If all traders are watching and using the same Fibonacci ratios or other technical indicators, the price action may reflect reality for you.
- You gain additional insights into market behavior.
- Traders who make profits using the Fibonacci retracement verify its effectiveness.
Defects
- Some experts believe the Fibonacci retracement levels lack adequate mathematical and reasoning background. This, they say, makes them unsuitable for use in financial markets.
- Others see them as a self-fulfilling prophecy. This is because traders around the world follow them when making decisions.
- And for those who believe in the value of Fibonacci. Understanding and interpreting the results correctly is not easy. You have to be good with this Fibonacci to use it properly.
Note
Let’s identify fibo retracement levels in small and large time frames to look for similarities. This will help you find the essential fibo levels.
With the interference of many fibo levels with each other actively. It is a sign of an impending reversal. Old fibo support levels are unlikely to become new resistance.
Fibonacci extension
Uses
This is the type of Fibo that helps you find the target that the price is aiming for. That is, after the price touches the areas of the fibo retracement, you will think about where the price is headed. This is the method to help you take profits.
Extended Fibo zones will be the answer to help you answer this question. To use this type of Fibonacci, you need to find 3 points: top, bottom and retracement. The Fibonacci levels used are 0, 0.382, 0.618, 1, 1.382, 1.618.
How to use extended Fibonacci
- The prices at the extended fibo are determined from the previous price swing, from low to high, by the ratios of 1.272 and 1.618 for support levels.
- Expansion levels are previously priced from top to bottom using the ratios of 1.272 and 1.618 for resistance levels.
- Usually, our 3rd price target would stop at 2.618 if you correctly identified two highs and lows.
Illustrated for ease of understanding: The extended fibo levels of 1.272 and 1.618 were known in advance from April 2 21 and bottomed on April 27.
To look for potential resistance when prices rise again on April 27. Knowing where the 1.272 and 1.618 fibo levels are is extremely valuable for a trade, as a solid bearish phase can occur as soon as this resistance level is reached.
That’s why the illustration above needs to define at least two bottoms in advance.

Evaluate
First, there is no way to know which Fibonacci extension will act as strong support or resistance.
There will be times when the price bounces back from the extended fibo. But most of the time, it goes through. The next problem is that we incorrectly define the peak, trough and retracement areas. This depends on the experience of each trader.
The meaning of the Fibonacci indicator
Fibonacci studies help estimate support and resistance levels. However, it cannot provide exact entry points.
Another important thing that traders should know is that Fibonacci tools should not be used alone but with other forms of technical analysis, such as Elliott waves, to get more accurate forecasts.
Study more about the Fibonacci tools to understand better how you can combine its strengths with other technical analysis theories. I hope everyone will find a suitable way to use Fibonacci to expand their trading tools.