

MFI is an important indicator, and many investors use it to analyze the market. With the continuous fluctuations of the financial market today, MFI helps investors make informed decisions to gain more profits and limit unnecessary risks.
Are you curious about this indicator? Our article below will help you answer some questions about the MFI index. Read it now.
What is MFI?
MFI (Money Flow Index) is a technical indicator used in technical analysis. This indicator uses price and volume to measure buying and selling pressure. It reflects the strength of the money flow of currency pairs, commodities, and stocks at a particular time.
MFI uses historical data to identify oversold/overbought zones, reversal signals, and identify current trends. However, this indicator is not too strong in identifying trends.
The foundation of the MFI is the RSI – an indicator used to measure price movements. Gene Quong and Avrum Soudark developed the MFI based on the RSI indicator but with the addition of a volume indicator. The authors argue that the price cannot accurately reflect the entire market; we must use more trading volume for the most correct judgment. MFI has contributed to the improvement of RSI.
Features and meaning of MFI
- Used to determine trading volume and investors often use 2 RSI and MFI indicators to achieve the highest efficiency.
- Volatility and change at different market periods. Depending on each market movement, the MFI will have different fluctuations.
- The MFI Indicator ranges from 0 to 100. MFI going to 0 means sellers are dominating and selling volume is higher, MFI approaching 100 indicates more bullish time than bearish, and buyers are dominating…Also, when the MFI is 0 or 100, the market is either overbought or oversold, and a reversal is possible, which is quite rare.
The formula for calculating MFI
To calculate the MFI, you must use many sources of information to bring into the calculation. Following are the steps to calculate MFI.
Step 1: Calculate the Typical Price by averaging 3 types of prices: the highest price, the lowest price, and the close price.
TP = (High + Low + Close) / 3
Step 2: Determine the cash flow value MF.
MF = TP * Volume
If today’s price is higher than yesterday’s price, the cash flow is positive, and if today’s price is lower, the cash flow is negative.
Step 3: Calculate the Money Ratio based on negative and positive cash flow.
MR = MF (+) / MF (-)
Positive/negative cash flow is the total positive/negative cash flow over the specified period. Usually, the time here is about 14 stages, but investors can change the time depending on their investment strategy.
Step 4: Calculate MFI
MFI = 100 – [100 / (1+MR)]
How to use MFI in trading
Identify trends
The market trend will be determined through the 50 lines of the MFI. If the MFI is above the 50 line, the market is trending up, and vice versa; when the MFI is below the 50 line, the market is trending down.
Determining the Oversell/ Overbought
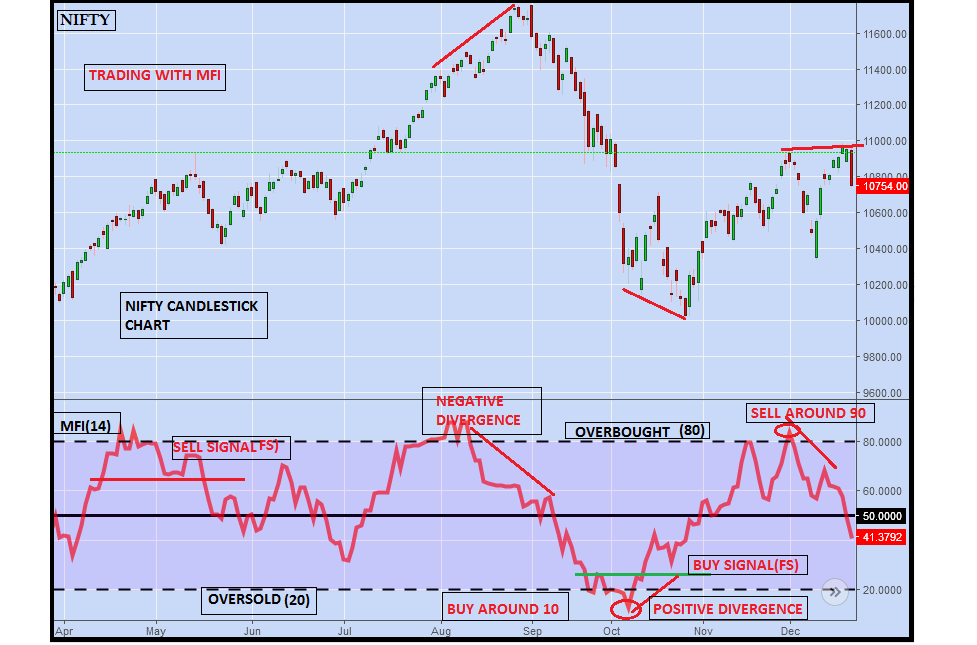
- Oversell: When the MFI falls below 20, it shows that it is entering the oversold area, so investors may consider selling the asset because at this time, the sellers have a lot of control and the selling pressure is quite high.
- Overbought: When the MFI exceeds 80, it shows that it is entering the overbought zone and showing signs of increasing, so investors may consider buying the asset because the buyers are dominating quite a lot with high buying pressure.
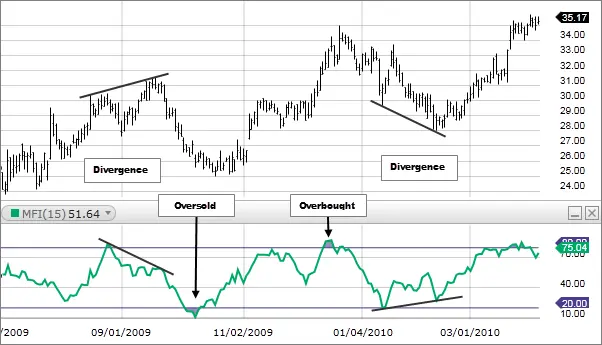
Identify reversal trades with divergence signals
- Buy reversal: in a downtrend, when there is a bullish divergence between the MFI and the price, it shows that the downtrend has signs of an end and may reverse to the upside. Investors can take advantage of this opportunity to buy assets.
- Sell order reversal: in an uptrend, when there is a bullish divergence between the MFI and the price, it shows that the buying trend has weakened, and the price will reverse to the downside. Investors can consider Sell orders now.
Combined with other indicators
The use of the MFI index also brings many benefits to investors, but with the current volatile market, investors can also combine the MFI with some other indicators to get an accurate view best on the market.
The EMA is a useful indicator that can be used in conjunction with the MFI. Combining these two indexes helps investors find Buy and Sell orders. Investors can consider a Buy order when the EMA crosses and turns up, combined with the MFI showing signs of moving into the oversold area (<20). Investors can consider buying orders if the EMA crosses and turns up and the MFI shows signs of entering the overbought zone (>80).
Limitations of MFI
- Since the market depends on many different factors, MFI can also generate false signals. Investors may get good trading opportunities, but the price may not move as expected, leading to a risk of loss of assets for investors.
- Divergence may not lead to a reversal.
- The market can be subject to great volatility from major events, and MFIs cannot predict these circumstances.
Summary
Overall, the MFI is a useful indicator for investors. It assists investors in making trading decisions. However, an investment decision should be further dictated by many other factors. Therefore, investors should have more multi-dimensional views to avoid unnecessary risks.
The article summarizes information about the concept, meaning, characteristics, and usage of the MFI indicator. I hope it is useful to you.