
Technical analysis is a method used by many investors to analyze the market. In technical analysis, many indicators support investors to analyze, one of which is preferred by investors, which is Parabolic SAR. This indicator is quite reliable in predicting price movements to assist investors in making the right decisions.
This article will introduce in detail and analyze some more functions and trading strategies of this indicator. Read the full article for more information.
What is Parabolic SAR?
In 1978, Parabolic SAR was first introduced in the book “New Concepts in Technical Trading Systems” Parabolic SAR was created by J. Welles – the Father of technical analysis indicators. J. Welles is a trained mechanical engineer who creates indicators such as RSI, ATR, Parabolic PSAR, MACD… Although born very early, J. Welles’ indicators remain relevant to the current trend.
The full name of Parabolic SAR is Parabolic Stop And Reverse; this name shows that the main purpose of the indicator is to determine the asset’s price trend and the overbought/oversold point. Investors can rely on this indicator to determine the exit point according to the old trend or the entry point according to the new trend.
The PSAR is represented as a Parabola on a chart and can identify potential price reversal locations. PSAR is used in markets like stocks, cryptocurrencies, forex,…
It can be said that PSAR is quite comprehensive, but to be more certain in determining buying and selling points, investors should combine this indicator with other indicators.
Characteristics of PSAR
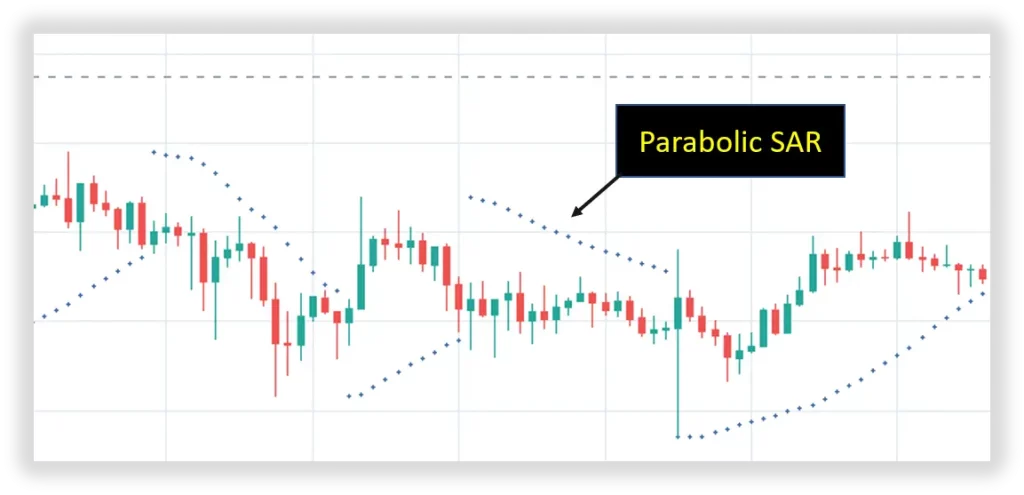
Looking at the chart, the Parabolic SAR is represented by the blue dots above and below the price chart. It gives investors an overview of the market’s trend and reversal points with the following main characteristics:
- PSARs are shown as dots adjacent to each other and fluctuate around a price chart.
- When PSAR moves below the price, the market is trending up, and conversely, when PSAR moves above the price line, the market is trending down.
- The farther the PSARs are from each other and the further away from the price line, the stronger the uptrend or downtrend of the market shows.
- The market will sideway if price and PSAR cross each other continuously and PSAR will be underperforming in this case.
- The price change will happen when the dots move from bottom to top or top to bottom.
Advantages and Defects of Parabolic SAR
Advantages
- Anticipate market trends.
- Limit false signals and latency.
- It helps identify investors’ sell signals and stop-loss points.
- PSAR against counter-trend trades
Defect
- Not promoting advantages when the market is sideways.
- Should only be used in a short time frame.
Formula of Parabolic SAR
Each PSAR dot represents the value of the indicator at a trading session with the following formula:
PSAR(n) = PPSAR(n-1) + AF * [ EP – PPSAR(n) ]
Where:
- PSAR(n): Current indicator value.
- PSAR (n-1): The indicator value in the previous trading session.
- AF (Acceleration Factor): acceleration factor, ranging from 0.02 to 0.2. This factor can be adjusted but should not exceed 0.22.
- EP (Extreme Price): These are the extreme price points of the trend. When the trend is up, EP is the highest price, and when the trend is down, EP is the lowest price.
Functions of Parabolic SAR
Parabolic SAR in determining buy and sell orders.
Depending on each market and trading strategy, PSAR can be different, but in essence, they all use the following way:
- Buy: when PSAR moves from above to below the price line.
- Sell: when PSAR moves from below to above the price line

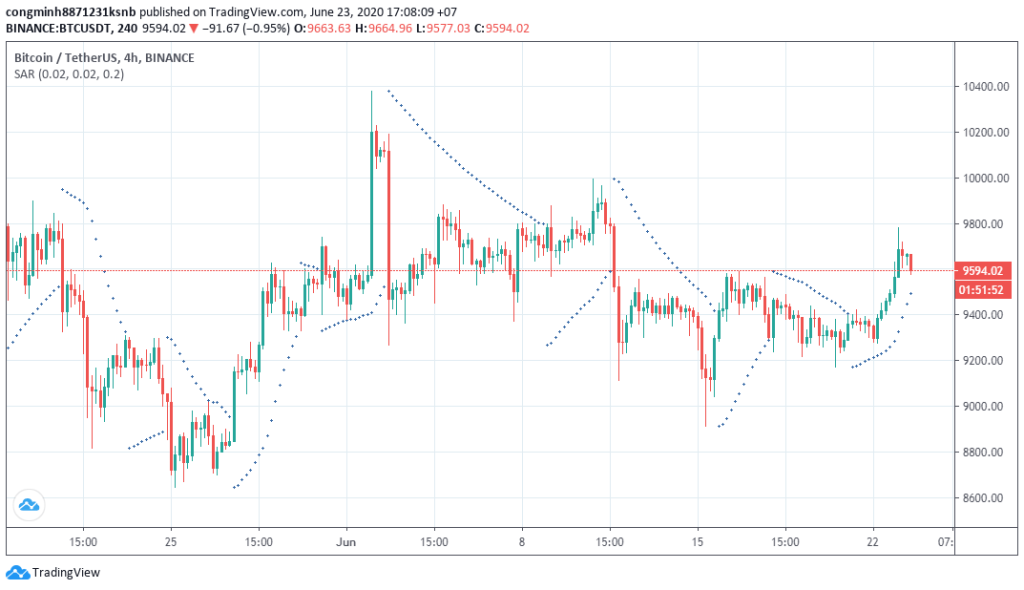
We will analyze the Bitcoin price chart above to understand this function better. From the last month to June, an uptrend may occur when PSAR is below the price, and investors should buy now. From the beginning of June to June 8, PSAR is above the price, so investors can consider selling.
Using PSAR is also quite simple because it assumes an up or down price trend. The function of PSAR will be most optimal when the market has a strong trend or a prolonged downturn when the price does not break a certain range.
PSAR in determining market trends
PSAR will help investors identify the market trend through its position relative to the price line, and the farther the PSAR is from the price, the stronger the force of the trend, specifically:
- PSAR is below the price line continuously; the market is in an uptrend with a relatively strong increase.
- PSAR is above the continuous price line; the current trend is strongly down.
PSAR in exit Point
PSAR is not only used for entry points but also exit points. When PSAR shows reversal points, investors should consider exit point, especially trend reversals suitable exit time:
- For holding a Buy order: when PSAR moves above the price.
- For holding Sell: when PSAR moves below the price.
To help you better understand this function, we will analyze an example chart of the EUR/USD pair.

At the beginning of September, prices started to fall rapidly, and investors might consider holding long positions. By December, the appearance of 3 dots of PSAR shows that the downtrend has ended, the price is likely to increase, and investors should consider exiting Buy points to avoid losses if the price corrects and returns to the same old position.
The PSAR indicator appears 3 dots showing the trend reversal, and investors can rely on the red for reference. However, when this signal appears, the price has moved for a while, affecting the transaction quite a lot.
Combine Parabolic SAR with other indicators
Parabolic SAR combined with support/resistance levels
Support and resistance are price zones that form when prices reverse or slow down in the past to create new tops, bottoms, or price trends. Investors can combine this indicator and PSAR to determine when the price will reverse to enter an order:
- PSAR gives a signal to enter a Buy order in combination with the price being at a strong support area, and it shows a good buy signal, and vice versa. If the price is at a resistance area, it shows a Buy signal that may be a noise signal.
- PSAR gives a signal to enter a Sell order, and the price at the strong resistance area shows a good Sell signal and vice versa; the price at the strong support area is at risk of a noise signal.
Parabolic SAR with trendline
Trendline is an indicator that helps investors identify the up and down trend of the market. Combining PSAR with Trendline is highly effective in identifying trend trades:
- When the price touches the uptrend line of the trend, and the PSAR is below the price, it will show a strong Buy signal.
- When the price touches the downtrend line, and the PSAR is above the price, it will show a strong Sell signal.
Summary
In general, Parabolic SAR is quite widely used to identify market signals. Investors can refer to it to create their own reasonable trading strategies. Note that it only works when the market is strong, and when it is Sideway, it should not be used.
Investors should also be careful because trading signals can be manipulated, and the market is also volatile, so before deciding to invest, research some other methods to ensure safety.