
In technical analysis, there are many useful indicators that investors can rely on to identify suitable trading times. Names like CCI, trendline, MFI,… are no longer strange to investors. Today we will introduce you to the Stochastic indicator. Let’s read the full article for more information.
What is Stochastic?
In 1950, George Lane, a technical analyst, noticed a change in momentum before the price changed. So he developed the Stochastic indicator. This indicator is gradually being used widely in indices, stock trading, Forex, cryptocurrency,… According to the author Stochastic depends on price momentum and speed, not on volume, price, or fish other factors.
Stochastic is an oscillator used in technical analysis that compares the closing price to the price range for a given time and then shows price momentum. Trading time is usually defined as 14 trading sessions and investors can change this time frame depending on each investor’s strategy.
Structure of Stochastic
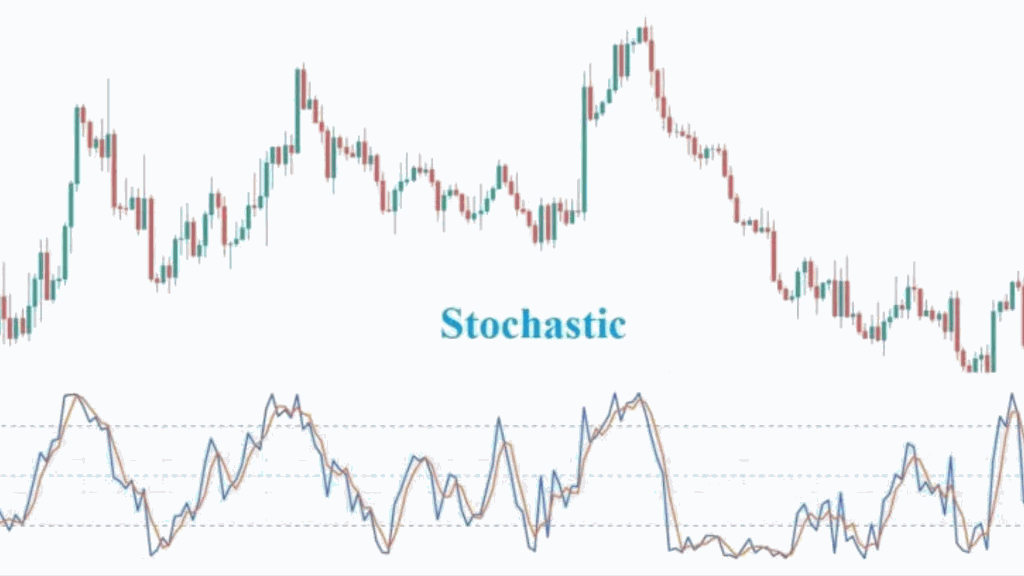
To form Stochastic, we need two main oscillators, %K and %D, specifically:
- %K: the main oscillator is shown as a solid blue line on the chart.
- %D: SMA of the %K line. Compared to %K, % will have a more significant delay.
- Stochastics range from 20 to 80.
When %K and %D cross, a change in trend is likely to occur. If the %K line crosses the signal line then the current closing price is closer to the low of the specified period compared to the previous three sessions, this is a sign of bearishness otherwise the opposite would be considered a price increase.
%K usually reflects the true value of price movements while %D is calculated based on the SMA of %K. Therefore, investors can rely on signals of %K and divergence of %D to execute trading orders and identify overbought/oversold.
Formula of Stochastic
Stochastic will be calculated based on %K and %D at the highest high, lowest low in the period under consideration. We usually have about 14 trading sessions in the form of days, months, and years.
Recipe:
%K =[ (A-C) / (B-C) ] x 100
Where:
- A: the last closing price.
- C: the lowest price during the specified period.
- B: the highest price during the specified period.
- The standard time to calculate %D is the 3-day SMA of %K.
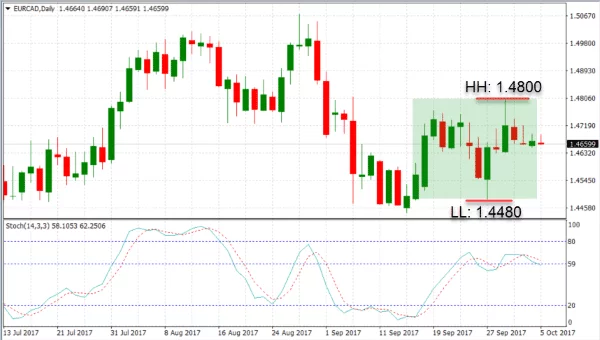
The chart showing the 14-period gauge, you will find a high of 1.48, a low of 1.448, and a current closing price of 1.467. We have the following calculation:
%K = [(1.4670 – 1.4480) / (1.4800 – 1.4480)] × 100 = 59
How to Use Stochastic in Trading
Trading at overbought and oversold conditions
Stochastic is commonly used for overbought/oversold trades or bullish/bearish divergences. Stochastic’s range will be limited so traders can use this indicator to identify overbought and oversold markets. Specifically:
- Stochastic > 80: the market is overbought.
- Stochastic < 20: the market is oversold.
- Stochastic is only between 20 and 100.
Market trends can change continuously but Stochastic can remain in overbought or oversold territory for a long time. Traders should trade in the direction of the trend and wait for regular selling when the trend is up and overbought when the trend is down.
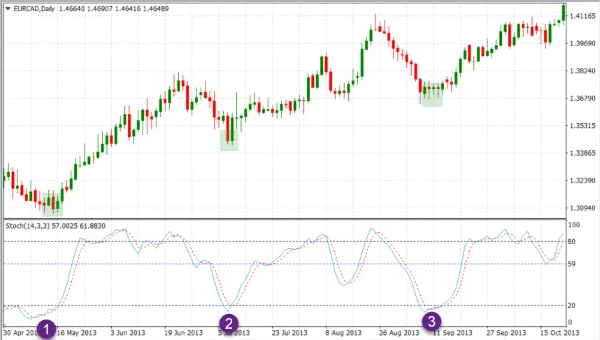
The chart above shows trading in the direction of the trend. Points (1), (2), and (3) on the chart represent oversold market conditions when the price is rising. This oversold level is created after each price correction and it signals a continuing uptrend.
The effective strategy, in this case, is to enter when %K crosses the signal line from below and the stop loss is below the previous low. You can combine waiting for other confirmation signals like candlestick patterns to avoid false results.
Up and down divergence
Divergence is used to identify the top and bottom of a trend to help investors determine when to enter/exit a trade. Price and technical indicators often move in the same direction. In the forex market, divergence occurs when the price and the indicator do not make a high and low at the same time.
- Bullish Divergence: the price chart forms lower lows when Stochastic forms higher lows.
- Bearish divergence: the price chart makes higher highs while the Stochastic makes lower highs.
Price and technical indicators usually move in the same direction. In the forex market, divergence occurs when the price and the indicator do not make a high and low at the same time.
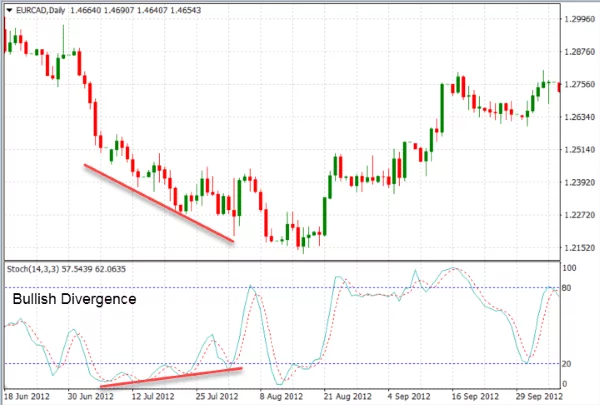
The chart above shows a more bullish divergence on a daily basis. The price makes consecutive lower lows but the stochastic indicator does not follow the price movement and it makes higher highs.
Price and stochastic diverged so the trend would change from down to the start of a new uptrend.
Combined with RSI
Stochastic and RSI are both momentum indicators that help investors know the overbought/oversold zone. The combination of these two indicators will help the trend reversal signals become more and more accurate.
- Buy order: Because the current main trend is up, investors must look for buy orders at the downward corrections. This signal is shown when both Stochastic and RSI are entering the oversold zone. The green candle confirms the bullish signal and coincides with confluence, investors can consider entering the order. Stoploss should be at the nearest bottom and investors should take profits according to their strategy
- Sell orders: the current trend is down and investors can consider sell orders in the bullish corrections. When Stochastic and RSI enter the overbought zone, a sell signal will appear. The most reasonable entry point is when the red candle confirms the bearish signal and coincides with the signal confluence area. Stoploss should be placed above the nearest peak and take profit according to the investor’s expectation.
Combined with the reversal candlestick pattern
The reversal candlestick pattern is very popular and used by many investors. In fact, the reversal candlestick pattern is really useful to investors. Combining this model with stochastic helps investors to both find the trend and find the best entry point.
Signs of a Buy signal:
- Stochastic < 20: the market is in the oversold phase.
- When Stochastic makes a later low higher than the previous low, the price makes a lower bottom lower than the previous low, and a bullish divergence signal between Stochastic and price will appear.
- The bullish reversal candlestick patterns will appear at the support or bottom of the downtrend.
Signs of Sell Signals
- Stochastic > 80: the market moves into the overbought zone.
- A bearish divergence between Stochastic and price will occur when the price makes the latter higher than the former while Stochastic makes the latter lower than the former.
- There are bearish reversal candlestick patterns at the resistance or top of the uptrend.
A reasonable entry time is when the reversal candlestick pattern is completed. Stop loss is placed on the top closest to the Sell order and the bottom closest to the buy order. Investors can take profits according to their campaign.
Note
- Should not depend on Stochastic signals to trade but must combine with other indicators. The more indicators, the more accurate the statements will be, but it is necessary to select the appropriate indicators to avoid messing up the analysis.
- Stochastic uses past data so there will be a delay.
- Stochastic in the short term is often more messed up than in the long term
- Investors need to have a reasonable investment strategy in terms of stop loss, profit taking, capital, and risk management,…
- Investors need to follow market trends to make transactions and minimize unnecessary risks.
Conclude
Stochastic is a pretty useful indicator to identify overbought/oversold zones and provide reversal signals. Each indicator has relative accuracy, so investors should combine indicators together to make the most informed decisions. At the same time, the study of many indicators also helps investors improve their knowledge and gain more multi-dimensional perspectives on the market.
Hope investors will understand more about stochastic after reading this article. Wish you have reasonable investment strategies to achieve the highest profit.