
In today’s financial market, many technical indicators are used by investors to analyze the market, including the Commodity Channel Index (CCI).
CCI is beneficial in financial markets such as stocks, cryptocurrencies, derivatives,… It helps investors quickly identify market trends even when the market fluctuates strongly.
CCI is a wise choice for investors. Follow the article below to learn the meaning and usage of CCI.
Origin of the CCI indicator
Centuries ago, agricultural producers began using futures contracts to ensure the future prices of commodities. Many technical indicators have emerged in this market to evaluate production activities, including CCI.
Donald Lambert introduced the CCI in a commodity magazine in 1980. Lambert originally developed the CCI to determine the cyclical turnover of commodities; all the same, the indicator is widely applied to indices such as ETFs, stocks, and other securities. CCI is gradually becoming popular among traders in identifying cyclical trends.
What is the CCI Indicator?
The CCI stands for Commodity Channel Indicator, is a versatile indicator used to identify price trends that helps investors determine whether they want to enter or exit a current trade. It is used to provide trading signals when it behaves in a certain way. The CCI indicates the imminent timing of a reversal in the trading cycle.
CCI is a momentum oscillator that measures the current price relative to the average price over a certain period of time. When prices are much higher, the average CCI will be relatively high, conversely, when prices are much lower, the moderate CCI will be relatively low. Therefore, the CCI can be used to identify overbought and oversold levels. Traders often use CCI to assess trend strength and find effective entry and exit points.
The formula for the CCI indicator
CCI is calculated by determining the difference between the average price of current and past prices to measure price movements in the market with the formula prescribed by the author as follows:
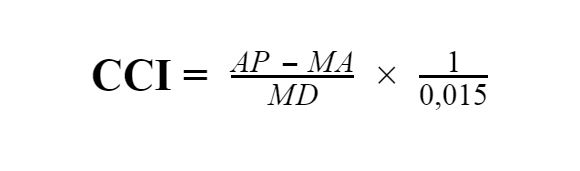
Where:
- AP (Average price): The average price, calculated as the average of 3 prices in a trading session. Formula: (High price + low price + close price) / 3.
- MA (Moving Average): The moving average, calculated on the average of closing prices over n trading sessions. Formula: (Closing price of session 1 + Closing price of session 2 + .. + Closing price of session n) / n). n is the time frame (originally, the commonly used timeframe was 20 days, but now a 14-day timeframe is commonly used.
- MD (Moving Deviation): The standard deviation of the MA. Formula: { ( MA – AP1) + (MA – AP2) +…+ (MA – APn)} / n
- 0.015 is a constant that is included to adjust the value of the indicator and ranges from -100 to +100.
The above formula will help you calculate the CCI, and if you find it complicated, you can find the support of the software. Currently, there are many smart software to support the calculation, such as MT4, MT5,…
The meaning of the CCI indicator
- Helps to track market trends, helping investors determine the point of buying/selling.
- Helps traders to detect the weakness in the trend when the price and the indicator are opposite to each other to make the right decisions about opening or closing orders.
- It helps measure market strength.
How the CCI indicator works
CCI is used to measure the difference between the current price and the average price over a period of time and fluctuates above or below 0 – this is a milestone representing the equilibrium price. When the market stabilizes, CCI will move around the 0 axis.
The movement of CCI reflects the positive and negative trends of the market. CCI rises above 100; the market is in an uptrend; CCI falls below -100, and the market has a downtrend.
In addition, CCI also tends to exceed the -100 and 100 ranges. For the meaning of a slow indicator and historical data analysis: CCI is above 100 or above, the market moves strongly and tends to trend increases, CCI exceeds -100 or below, and the market tends to decrease. For future forecast: CCI exceeds 100 or more: the market has increased strongly and has a downward correction trend; CCI exceeds -100 or below, the market has fallen too far and shows signs of an upward correction.
About two-thirds of the CCI’s value is between -100 and 100. The remaining one-third is outside of that range. This shows the weakness or strength of the price movement.
CCI helps investors know buy and sell points and predict average price reversals. CCI will promote its best advantages in sideways market conditions but will be restrained often in the trend market.
Function of CCI
Use CCI to identify trends.
CCI predicts market trends quite accurately. Investors can time the trade by identifying the trend through the CCI’s moving line.
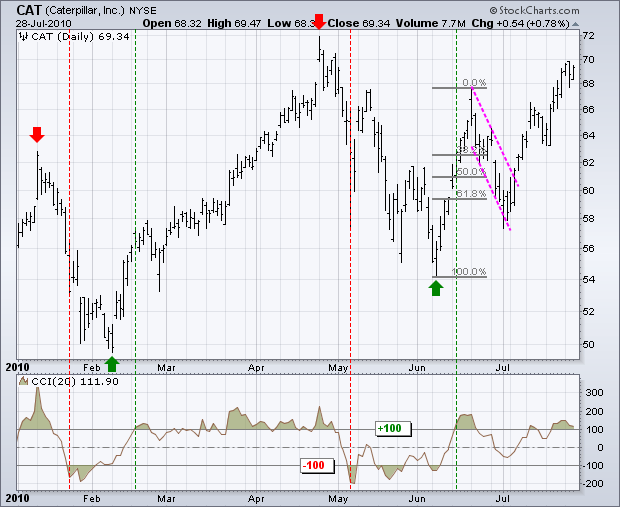
To better understand the trend identification by CCI, we will analyze the chart above. This chart uses CCI – 20 days. Looking at the chart, we can see that in 7 months (1/2010 – 7/2010), there are 4 trend signals illustrated by green and red arrows.
We can easily see that CCI – 20 days is unsuitable for long-term signals. It is recommended to analyze the chart by weekly or monthly milestones.
On 11/1, the asset peaked and then collapsed, causing the CCI to move below -100 after the next 8 days and show signs of starting a long move.
On 8/2, the price bottomed, and 6 days later, CCI moved above the forecast 100 for a prolonged correction.
In June 2010, CCI showed signs of increasing when the price was above 60. This indicates that some traders may have considered overbought.
With the upside this time, the focus is on bullish setups with low risk-reward. The asset has recovered about 60% of the previous crash and formed a flag pattern at the end of June. This next rally represents another bullish sign; the CCI is still growing.
It can be seen that CCI does not accurately capture highs or lows, but it can filter out insignificant small signs and focus on the larger trend.
Identify overbought and oversell levels with the CCI indicator
By monitoring the market with CCI, buyers can identify the time of overbought and oversold. However, in some cases, this can be difficult for CCI, specifically:
- CCI has no upside or downside limit; it can move greater than 100 or less than -100, resulting in subjective overbought or oversold assessment.
- When the CCI is overbought, the price can continue to move higher, and the price can continue to fall when the CCI is at the oversell.
The CCI has different definitions of overbought and oversold. In recent years, some traders have modified the CCI trading rule by using the new ranges of -200 and +200 as oversold and overbought signals. In addition, mean reversion will occur when CCI moves to -200 and +200.
Scaling to -200 and +200 is a much harder level to achieve. We will come to the GOOG asset example to better understand the scope. Take a look at the chart below to analyze the usage of GOOG’s CCI-20 indicator.
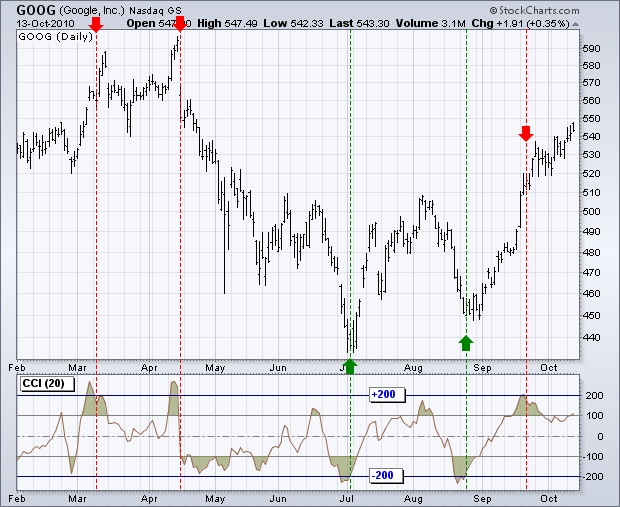
This chart has been supplemented with 2 more levels, -200 and 200. During the period February to October, CCI exceeded 200 times 4 times. The red dashed line shows the CCI moving below 200, and the blue color shows. CCI moves back above -200.
Through the above example, it can be seen that the signs of this pattern are not clear. Mid-September and GOOG continue to move higher, although CCI is at the overbought level and tends to move below -200.
Bullish and Bearish Divergence
In technical analysis, a divergence indicates that the price movement is opposite to the direction of the indicator. Based on the signs of divergence, investors can identify good signals to decide to enter the trade. Usually, to identify trend reversals, people use the following two types of divergences:
- Bullish is a bullish divergence. It occurs in a downtrend. When a divergence occurs, the price decreases, and the CCI forms a new higher low. This represents less downside momentum. Bullish assists investors in identifying a possible uptrend but to be sure, you should combine other factors for more accuracy.
- Bearish is a bearish divergence; it occurs in an uptrend. When the price makes a later high higher than the previous high, and the CCI makes a lower high lower than the previous high, there is a possibility that a bearish reversal will occur because the uptrend has weakened. Investors can refer to Bearish for trading but also need to observe many other factors to avoid unnecessary risks.
The process of divergence can help investors refer to future trends. However, Investors should still be careful when using this indicator because it can be risky when the trend is strong.
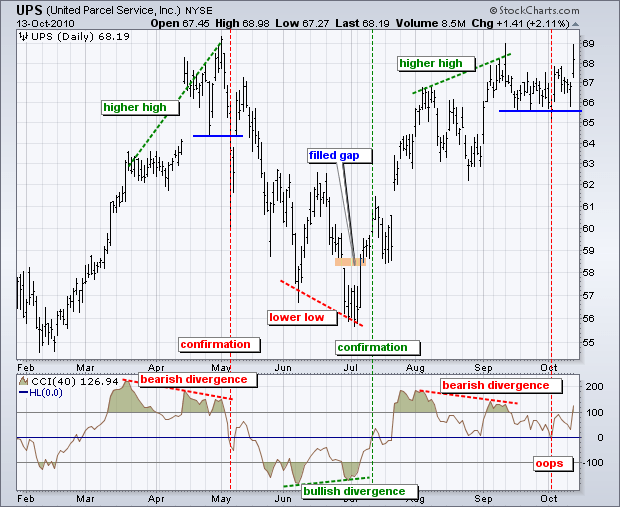
The chart above uses a longer time frame to reduce price volatility with CCI – 40 days. During the first 7 months, 3 rather large divergences occurred:
- The price pushed to a new high in early May, but the CCI failed to break above the March high, and a bearish divergence appeared. CCI moved into the – 100 zone with the appearance of a divergence a few days later and a breakdown of the price support area on the chart.
- At the end of June, the asset price filled the GAP, and by July, there was a bullish divergence, with the price moving to a lower low. CCI formed a higher low, and a move to the 100 zone made the difference.
- In early September, a bearish divergence occurred, with the CCI moving into the same -100. Despite the CCI confirmation, the price failed to break the support zone, and there was no trend reversal when the divergence occurred.
In general, divergence is a sign that helps investors to make decisions for their trades. But not all divergences produce good signals, there are many possible scenarios. Therefore, investors should carefully analyze to make informed choices.
Limitations of CCI
- Overbought and oversold levels are subjective because CCI does not have a fixed level, investors mainly analyze based on knowledge and experience.
- CCI has a certain delay that makes the information possible to be slower than the current price.
Note when using CCI
- See if there are reversal signals from other tools to make the most accurate decisions.
- Watch to see if the current price is above a strong support or resistance line.
- Observe if divergence occurs to predict the possibility of a trend reversal.
Summary
In short, CCI is an indicator that helps you predict the trend to capture the best time to enter a trade. Therefore, investors should properly combine with other indicators to be able to make accurate investment decisions.
Hope the article will be useful for investors. Thank you for reading!