
Trendline is a technique that is no longer strange to investors. Trendline helps investors to know the current price movement direction and helps investors’ trades succeed. The risk will be minimized if the trendline is correctly identified.
The following article will help you know the trendline. How to draw a trendline? What is the use of a trendline? What are the characteristics of trendlines?
What is Trendline?
Trendline is a tool in technical analysis that helps investors identify market trends or price movements. Trendlines are determined based on the top and bottom of the price.
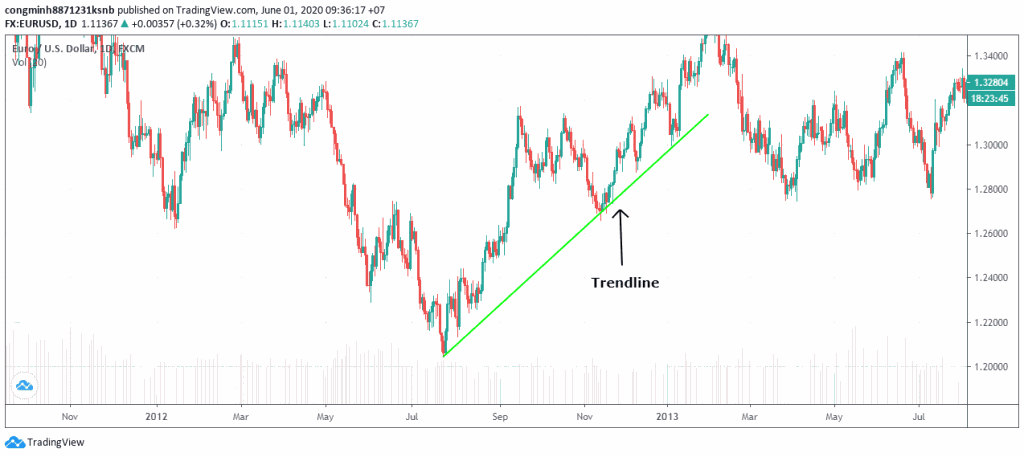
Trendline is made up of connecting peaks and troughs, however, there are some cases where trendlines are also connected from top to top or bottom to bottom. The bottoms and tops of the trendline must satisfy the requirement that the back peak is higher than the previous one.
The purpose of the trendline is formed to help investors can rely on past prices to determine future prices. Trendline is very helpful for analyzing the price direction and speed of the market. In addition, the trendline is also a support and resistance line to help investors determine the correct entry point.
Types of trendlines?
Currently, in the market, there are 3 popular trendline types. The characteristics and meaning of each type are not the same. Specifically:
- Uptrend is a straight line connecting the bottom to the bottom, the latter bottom is higher than the previous bottom and when the price touches this line, it will bounce. The uptrend represents the uptrend of the market and is also known as the support line.
- The downtrend is the line connecting the tops, the next peak is lower than the previous one and when the price touches this line, it will drop. The downtrend represents the downtrend of the market and is also known as the resistance line.
- Sideway is a horizontal line that occurs when the price does not have much movement causing the top and bottom to move sideways to form a straight line when connecting them. At this time, the market does not have a strong move, so investors should consider stopping investment at this time.
Usually, we will encounter Uptrends and Downtrends more because the market is very volatile with many big and small fluctuations. In fact, the sideways trend is very rare.
Trendline drawing tutorial
Uptrend
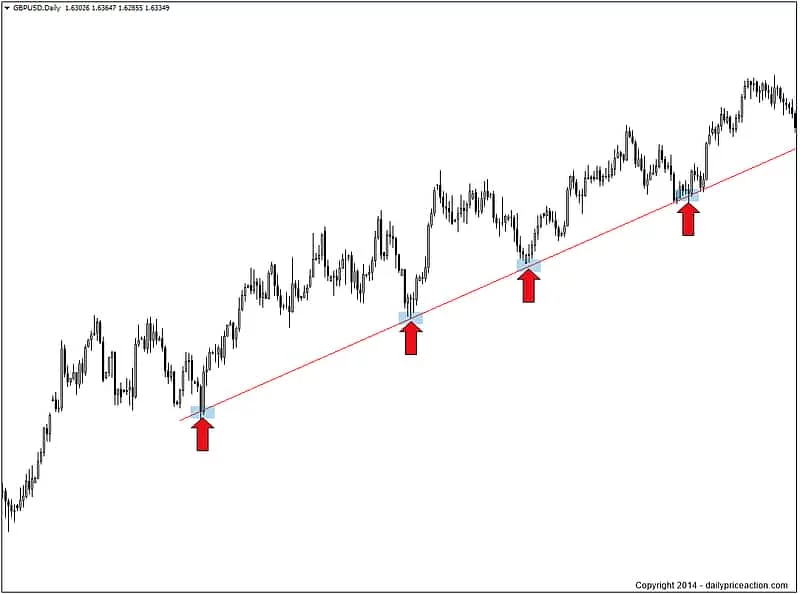
The characteristic of this line is that it is below the price. You need at least 2 bottoms in accordance with the principle that the latter bottom is higher than the previous bottom and connecting them together will create an uptrend.
When the price touches the trendline many times over a long period of time, this trendline will be called a support line. Investors can look for opportunities to buy or enter a long position.
Downtrend
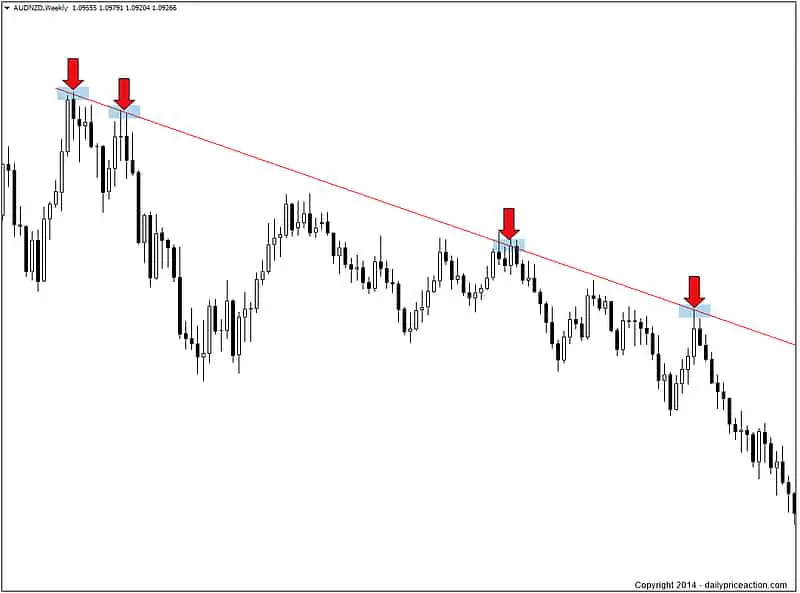
This trendline will be above the price. To create this line, we will connect 2 vertices together so that the next peak is lower than the previous peak, a downtrend will be made.
If the price touches the trendline many times over a long period of time, this trendline represents resistance. Sell orders or short orders at this time will give investors the opportunity to make profits.
Meaning of trendline
- Identifying support and resistance zones helps investors to make the best options for buying or selling to gain profits.
- Two parallel trendlines will form a price channel. Investors capture most of the price of the current trend in the price channel to determine the optimal buy and sell point.
Notes when using trendline
- Drawing a trendline with multiple peaks or troughs will ensure greater accuracy.
- A strong trend is evident when the price touches the trendline many times without being broken (when broken, the possibility of a price break is very high).
- The market is very bad which will lead to not being able to draw the trendline correctly.
- The trend can be represented as a price range, a parabolic line.
- The steeper the trendline, the easier it is to break, but when the slope is less, the trendline also decreases in significance.
- When the trendline is broken, the support and resistance levels will switch roles.
- Do not try to adjust the trendline to fully match the market.
Some experience when determining trendline
- It is recommended to use 3 points to confirm a trend because the steeper the trendline, the stronger the trend, leading to easily breaking and forming a new trend. Therefore, drawing with many points will ensure higher accuracy.
- It is recommended to use a high time frame such as week, month, or year… to ensure the certainty of the trend due to high reliability.
- A perfect trendline is rare.
- An invalid trendline should not be turned into a valid one. Some trend lines may not be suitable for the market and if you try to turn it into a suitable one will wrongly affect your decision.
Trendline strategy in trading
Strategy when the trendline is supported/resistance
When a trendline becomes a support or resistance line you can use it to determine how long it will take for the price to return to the point where the trendline you drew touches the price.
The chart above depicts you participating in the margin with the trendline drawn as above. Based on this chart we can see that the trendline acts as resistance and if you find resistance at the trendline, you can consider using a Short order with entry and notice that the stoploss point is above the trendline.
Trend Breaking Strategy
This method is quite popular with many investors. It is used to identify potential market reversal points.
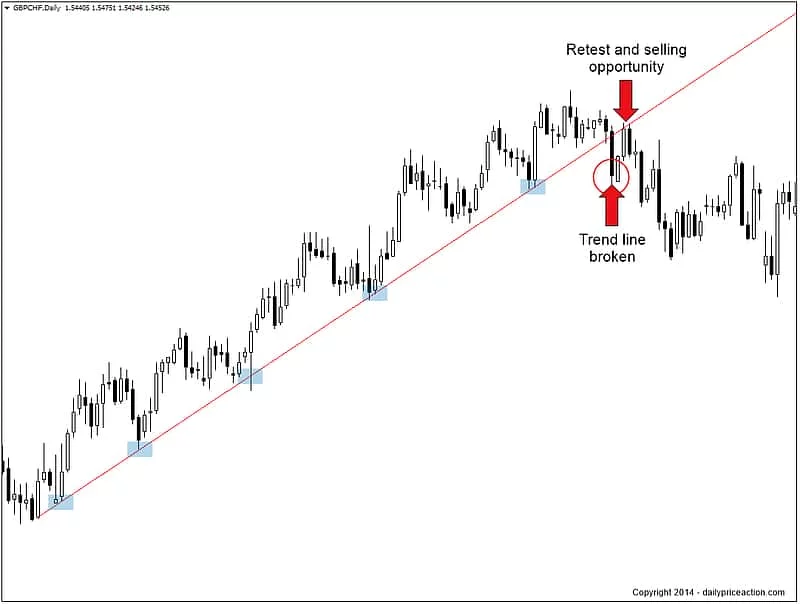
Looking at the chart above, we see that the support level was broken and the price turned up to form a new resistance level. Investors can use the Breakout points to determine the entry into the order in 2 ways:
- When the price crosses the trendline, it is recommended to use a Short entry order at that point and the Stoploss will be placed above the trendline.
- When the trendline is broken, the price breaks through the trendline and the price goes back to the resistance line. If the breakout is true then you should use a short entry and the Stoploss will be placed above the trendline.
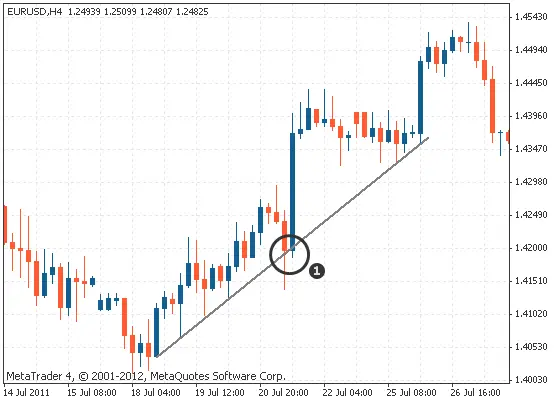
The case needs to be careful when trading based on the trendline
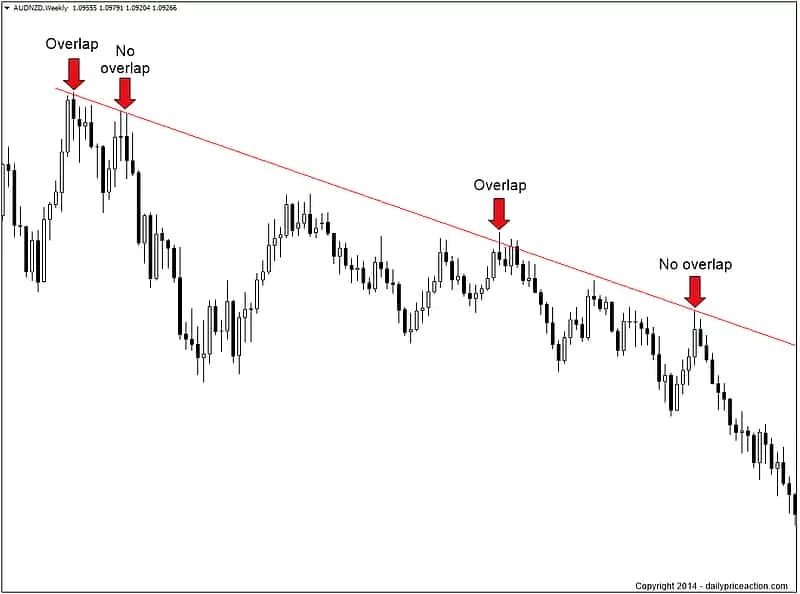
Trendline is a tool that advises your campaigns. It is not completely accurate and cannot give you a specific time for deciding trades. In some cases, the market will also behave differently from the trendline. We will analyze the chart below to better understand.
The market above shows you are trading a breakout with the trendline as support. If you place a short order at the moment the price moves below the trendline, then when the price turns up immediately you will lose. In this case, you should enter the trade when the price closes below the trend line or it turns back to support and then forms a resistance.
Summary
Trendline is a useful indicator to support investors’ trading decisions. They can use it to identify trends and find reasonable entry points. However, you should use this indicator as a reference and should learn more about other indicators and market realities to be able to make the best decisions.
This article has raised some points about trendlines and how to use this indicator. Hope it will help you a lot in investing. Good luck