
As an important indicator and always accompanied by price & market capitalization, BTC Dominance (BTC.D or Bitcoin Dominance) is used by many traders to make decisions when investing in any coin/token. So what exactly is Bitcoin Dominance, and what does this indicator represent? Let’s find out in the article!
What is BTC Dominance?

BTC Dominance (BTC.D, or Bitcoin Dominance) is the percentage of the market capitalization that Bitcoin occupies over the total capitalization of the entire cryptocurrency market. Bitcoin Dominance shows how much users are pouring into BTC compared to the total amount pouring into the market.
For example, BTC Dominance is at 60%, this can be interpreted as BTC capitalization is 60% of the total market cap and altcoins (coins/tokens other than BTC) make up 40% of the total market capitalization.
As the first and largest cryptocurrency, at the time of launch, Bitcoin had BTC.D at 100% at ATH. However, as the market matured and more tokens began to appear, it gradually lost its dominance and once reached an ATL of 35.41%.
Users can easily access the BTC Dominance index when searching on TradingView; it is an important indicator many Holders and Traders use in their trading strategies.
Why does BTC Dominance matter?
Bitcoin is not only the largest cryptocurrency but also the leading coin. Most other cryptocurrencies follow suit in most cases, whether the Bitcoin price rises or falls. Therefore, BTC Dominance is very important if an investor wants to track the movement of Bitcoin in general and the crypto market in particular.
Supposedly, if BTC Dominance increases, Bitcoin is taking up more of the total market cap while altcoins have less. In other words, Bitcoin will likely increase in price while altcoins will fall.
How to calculate BTC Dominance
BTC Dominance is calculated by taking the ratio of Bitcoin’s market capitalization to the total crypto market capitalization.
For example, the data provided by Coingecko as of now (November 7, 2022) shows that the Cryptocurrency Market Cap is $1.082 trillion, while that of Bitcoin is $403 billion. We can calculate Bitcoin Dominance as 37.24% (403/1082 * 100%).
How Bitcoin & Money Flow in Crypto
The Crypto market has its own characteristics; the money flow does not pour evenly into the market or each project but tends to pour from the top down.
BTC → Top Altcoin → Altcoin Mid cap and Low cap → Cash → BTC…
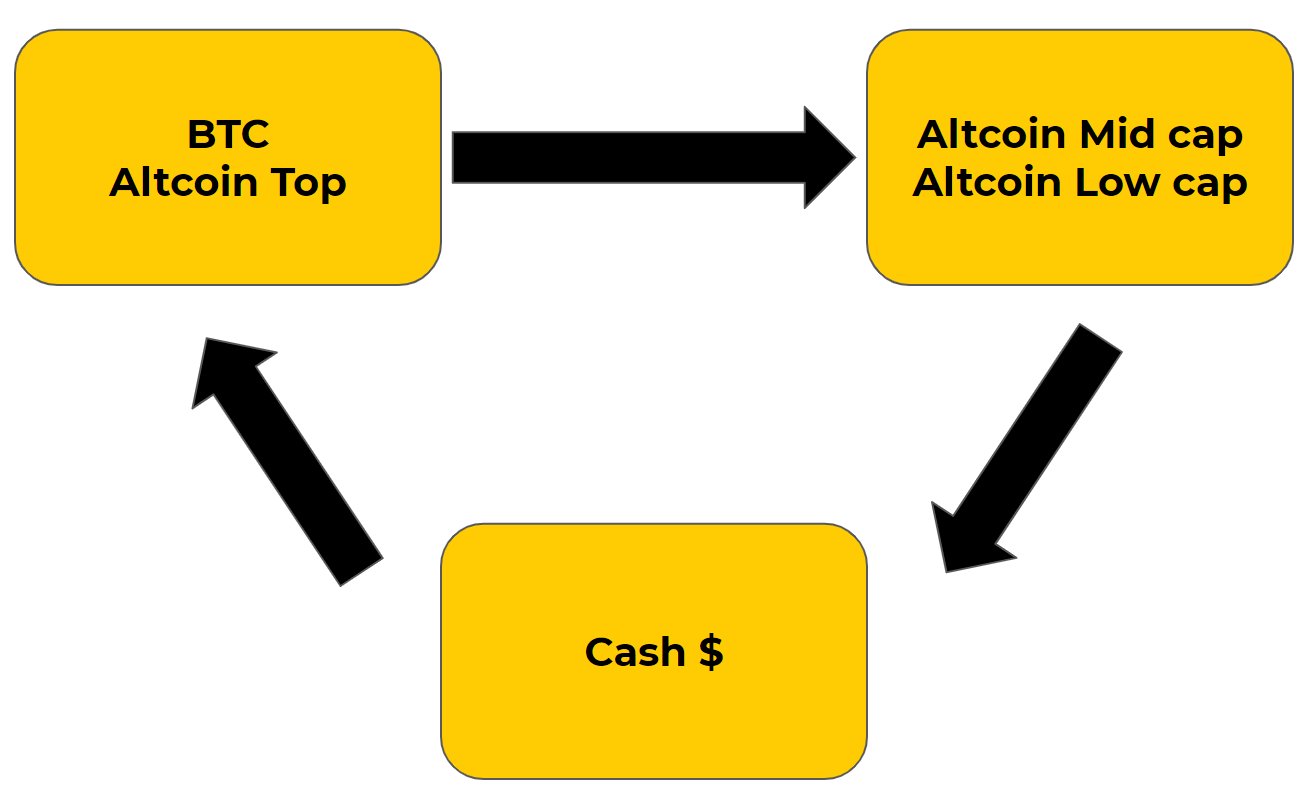
The flow of money circulating in Crypto tends to pour from the top.
Of course, this is a general trend; there will still be exceptions in the market, such as those affected by the news, events, and fundamental analysis factors, …
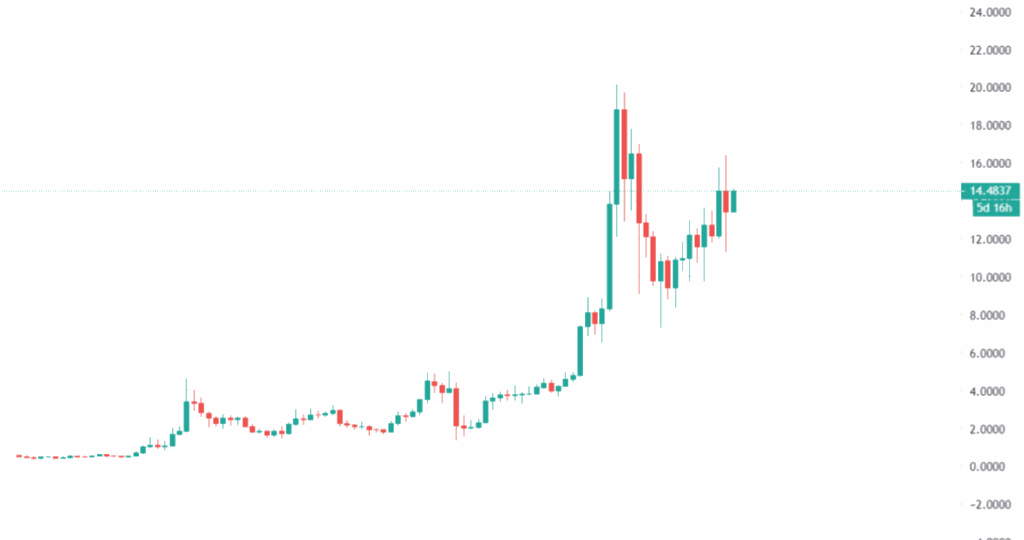
For example, projects backed by good fundamental analysis, these Coins & Tokens all have a long-term upward trend, typically Chainlink (LINK).
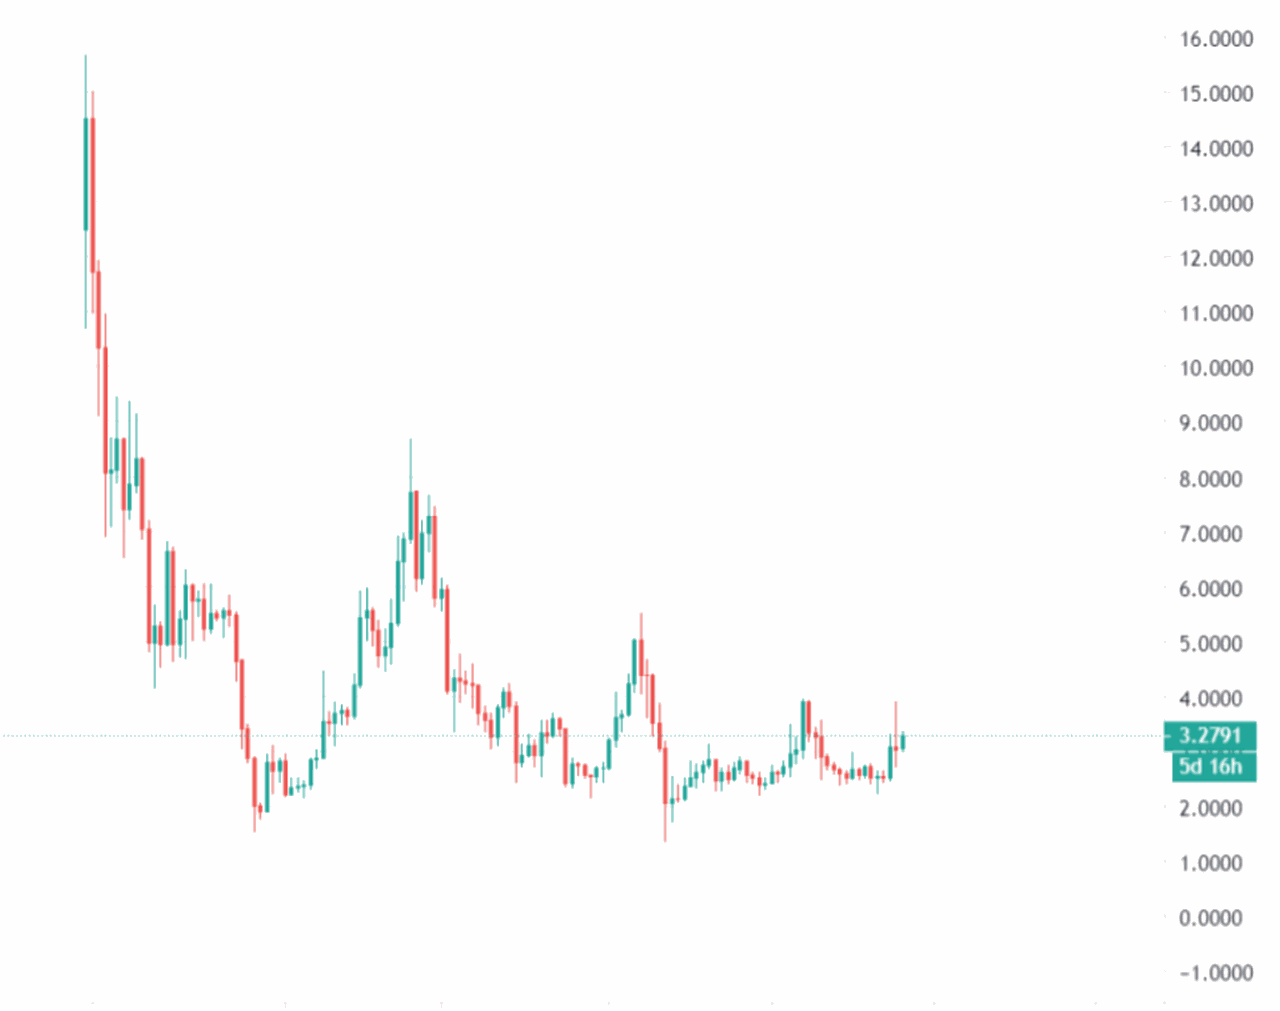
Or conversely, projects with fundamental analysis that are not good for long-term holding all have a long-term downtrend, whether the general trend is up or down, which is typical for this case. This is EOS – a very “HOT” project in 2018.
So how will we use this BTC Dominance to make as much profit as possible from the market?
How to trade with BTC.D?
By combining BTC price trend analysis and BTC Dominance, we will get some trading strategies on a case-by-case basis, which readers can see in detail as shown in the figure below.
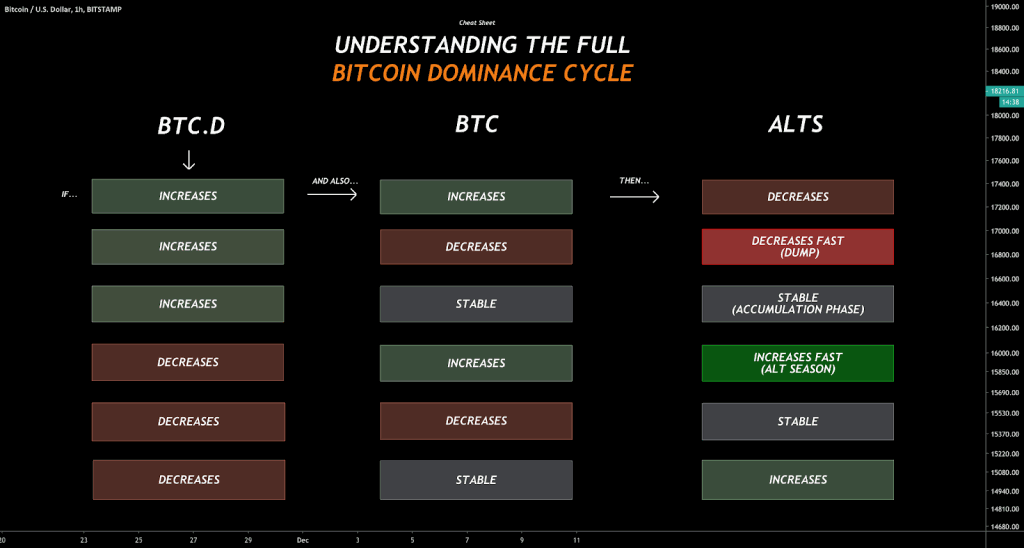
In the image above, cases can happen with BTC.D and appropriate actions depending on the situation.
BTC.D rises
BTC Price Rises: Money is flowing from altcoins to BTC.
BTC Price Falling: The entire crypto market as a whole is down.
BTC Price Flat: Investors are taking profits from altcoins to Fiat/BTC.
BTC.D drops
BTC Price Rises: Money flows into BTC, which could drag altcoins and the entire market.
BTC Price Falling: The entire crypto market as a whole is down.
BTC Price Flat: Money is flowing from BTC to altcoins. Bitcoin’s sideways movement means it will have little impact on the price of altcoins, allowing them to grow freely. Promising fundamental altcoins will surge during this period.
BTC.D is flat
BTC Price Rises: Money is flowing from outside crypto to BTC.
BTC Price Falling: The entire crypto market as a whole is down.
BTC Price Flat: BTC stands still, allowing altcoins to grow unaffected.
Specifically, the strategy in the first line can be interpreted as When BTC.D increases ⇒ BTC price will increase ⇒ investors should buy BTC to make a profit, or those who are holding BTC can consider taking profits shortly.
These strategies can be combined with flexibility with Holder’s or Trader’s trading strategies, including Hold and derivatives trading.
Example 1: If the user is a trader, when analyzing if BTC.D is trending up and BTC price is also trending up, people can predict that BTC price will continue to increase.
⇒ A simple and highly effective strategy is to trade against the trend: favoring Long BTC.
Example 2: If the user is a holder, we had a great time buying and holding Altcoins in May.
⇒ Simple and highly effective strategy is Buy – Hold Altcoin and wait for the profit-taking point.
How to determine the trend of BTC.D
Interestingly, BTC Dominance can also be identified as a token or coin price chart with indicators in technical analysis such as MA, EMA, Ichimoku, support, resistance, patterns, and RSI… Investors can consider BTC.D like a coin and analyze the ups and downs based on the above indicators.
For instance, using the Indicator Ichimoku Cloud to comment BTC.D. Learn it through the article: What is Ichimoku Cloud?
Now let’s start determining the trend of the BTC Dominance chart:
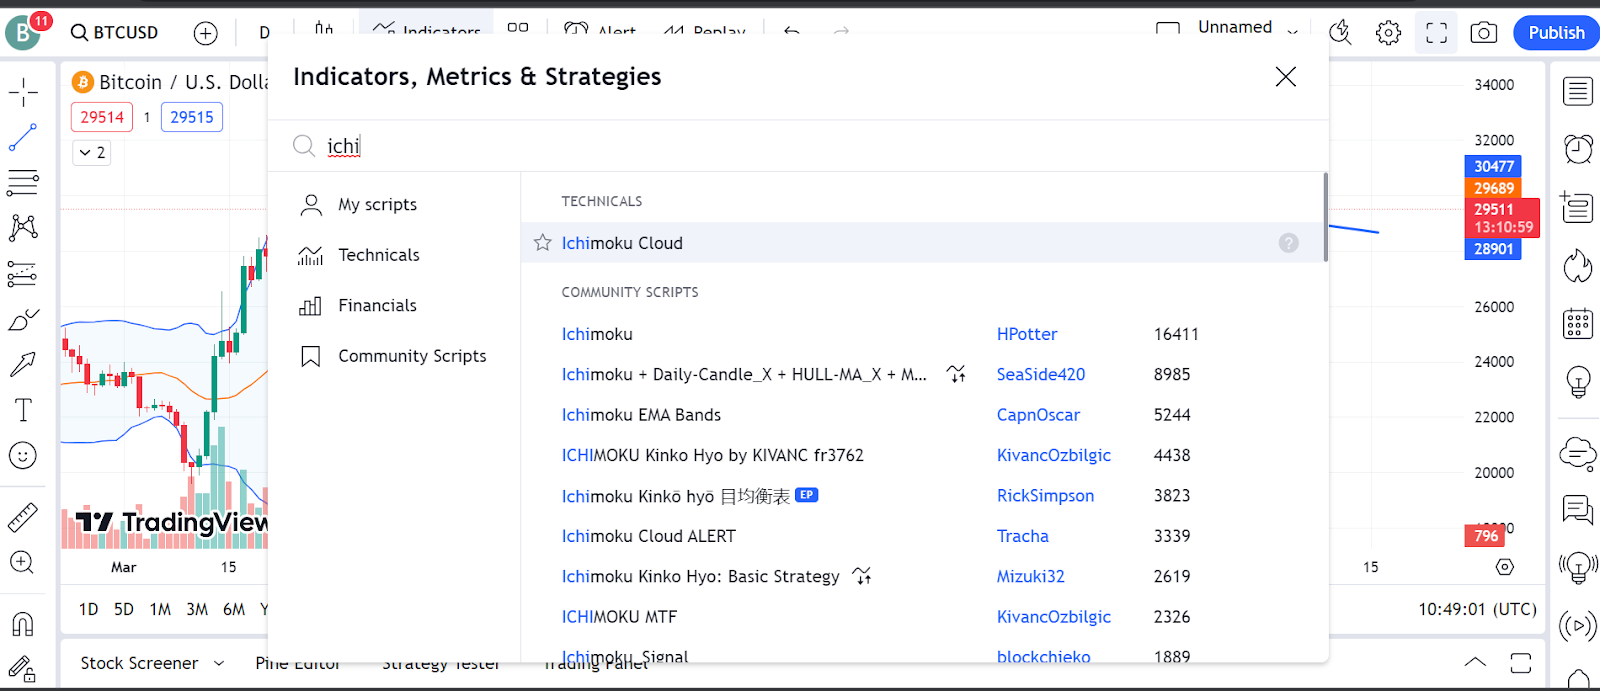
Step 1: Go to tradingview.com → Go to the chart → Search and add the indicator “Ichimoku” to the Chart.
Step 2: Remove all unnecessary components, leaving only the clouds.
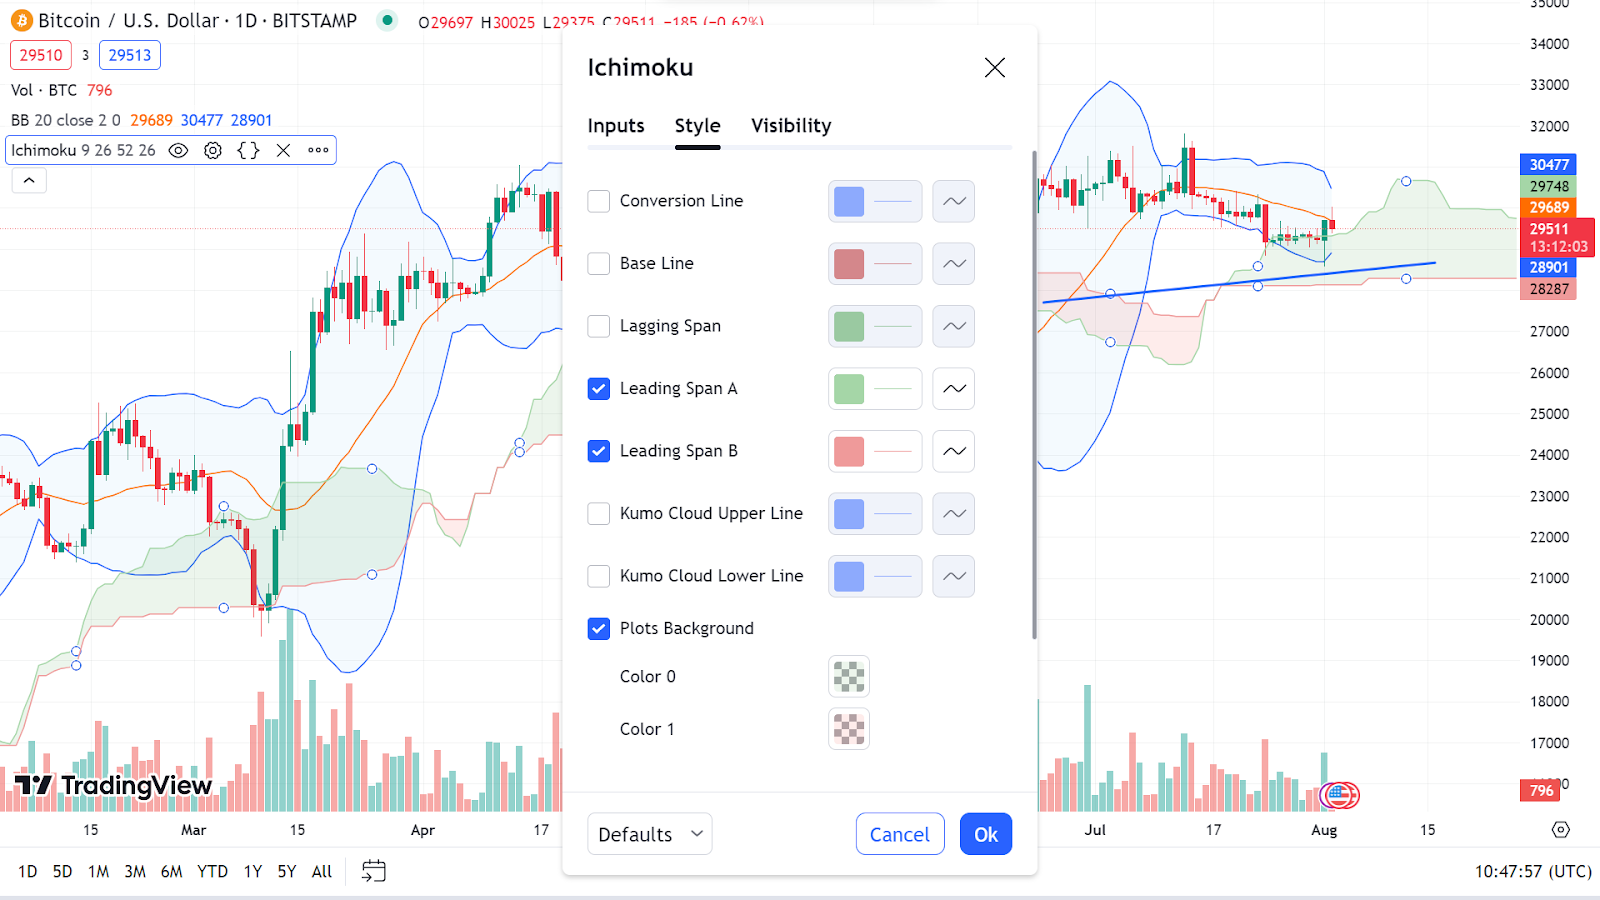
After completing step 2, our chart is much easier to see; the last step is determining the trend of BTC.D through the chart.
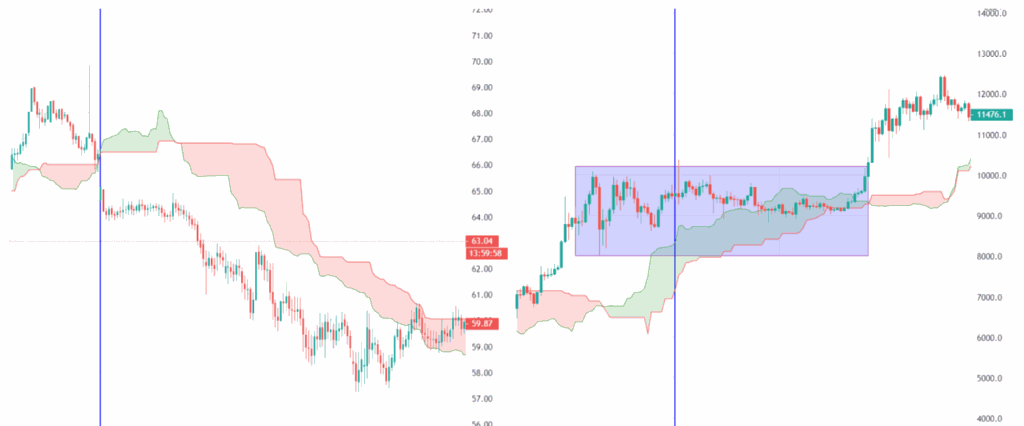
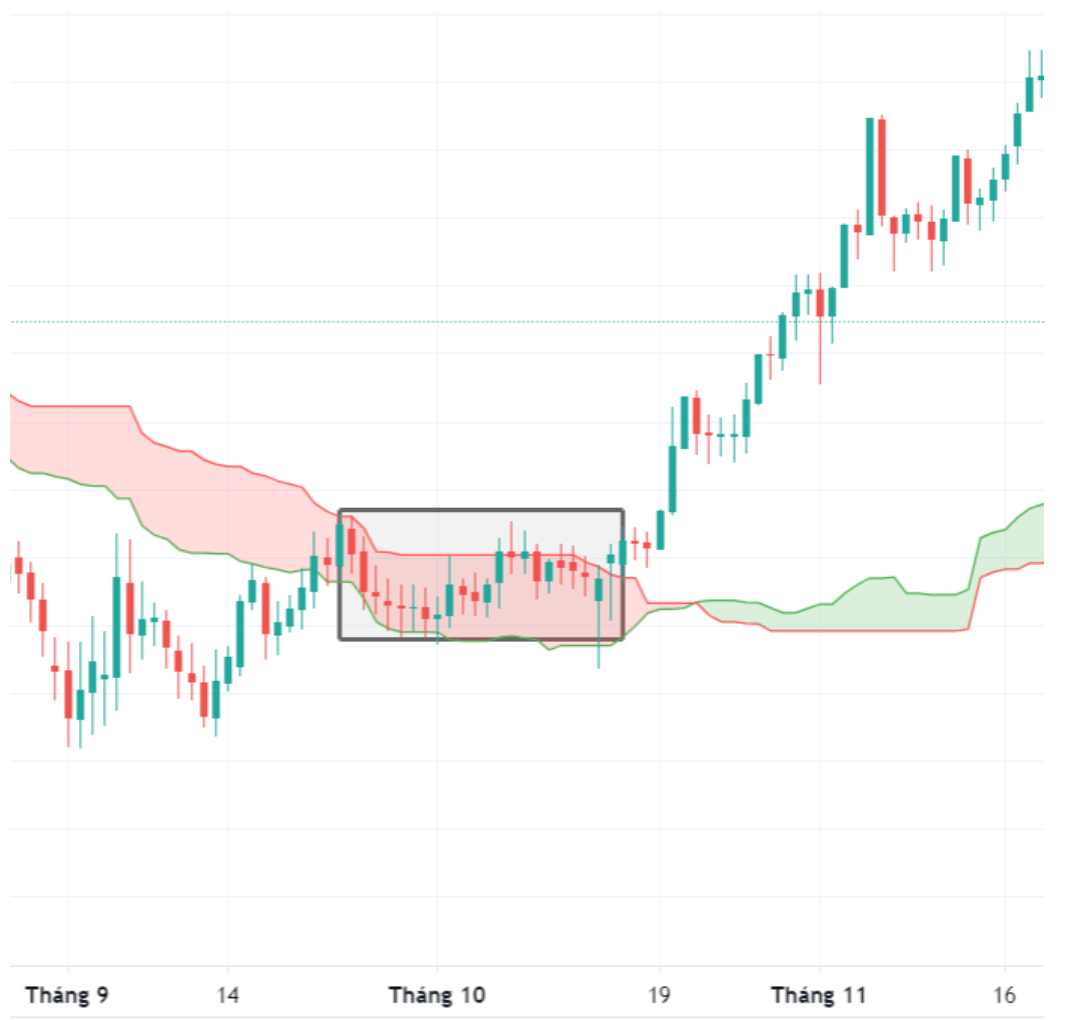
Step 3: Identify trends with Ichimoku Cloud.
Identifying trends with Ichimoku is simple.
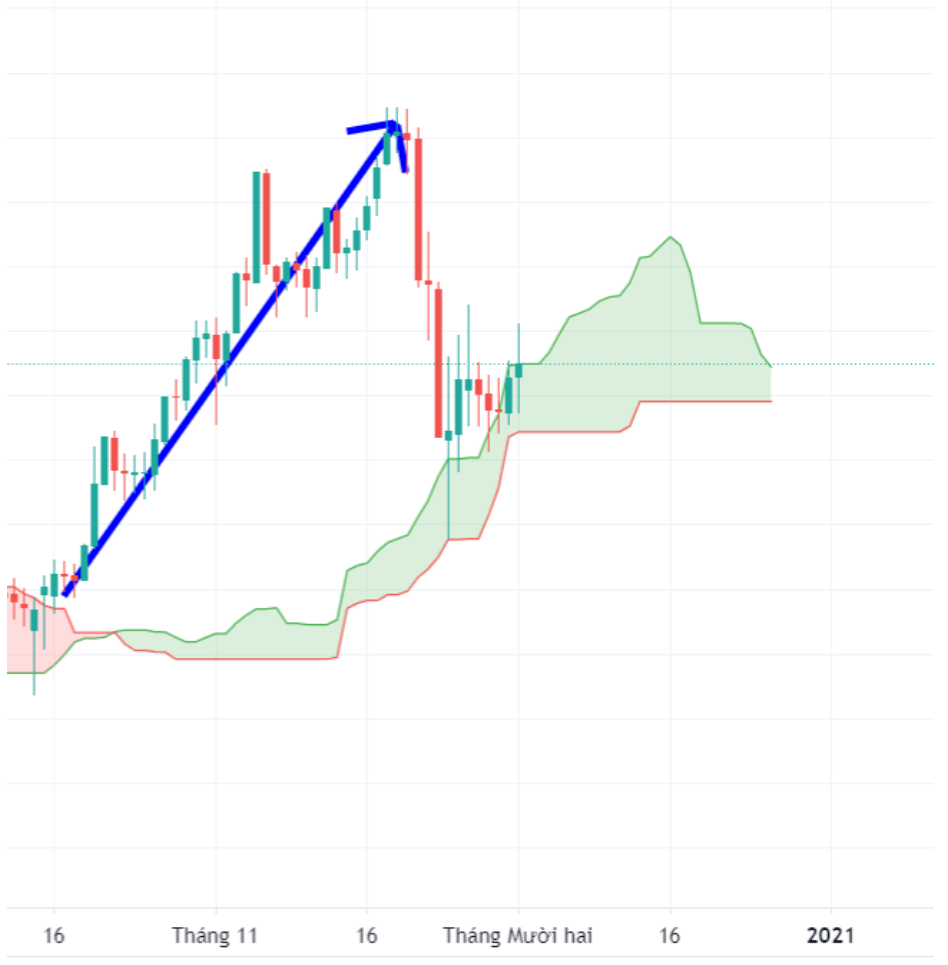
Uptrend when the price is above Ichimoku Cloud:
Downtrend when the price is below Ichimoku Cloud:

The trend is not clear when the price is in the Ichimoku Cloud
Note when determining the BTC Dominance trend with Ichimoku Cloud
In the writer’s experience, readers should use this method to determine on large frames; it will be more effective because signals in this way have a significant delay (price has run for a while, the signal will be confirmed). Receive).
Users can combine with other indicators, such as Support – Resistance, Trendline, Fibo, MA, etc., to bring better results.
In addition, users can combine multi-frame reviews for more diverse multi-view:
H4 – Daily: Daily.
Daily – Weekly: Weekly.
H4 – Daily – Weekly: Combine days and weeks.
Limitations of the BTC.D Index
The approach to Bitcoin Dominance above is oriented toward technical analysis so that the BTC Dom determination process will have the same limitations as technical analysis, such as:
Analysis may have errors: The main feature of technical analysis is to use past data to predict the future, so errors are inevitable.
Relativity: At the same time, the same chart, the same indicators, but two analysts can make two opposite opinions. Therefore, BTC.D is only approximate, not wholly accurate.
There are always conflicting opinions.
Because of the above limitations, the writer thinks that, when investing with BTC.D, investors should not be All-in but need to have a reasonable capital allocation plan. In addition, investors can also combine fundamental analysis to choose the right coin, then use technical analysis to select the optimal entry time.
The Future of Bitcoin Dominance
This indicator has been around for a long time and has also proven extremely useful in assessing the current market and predicting the future market.
Therefore, there is a strong possibility that for many years to come, BTC Dominance will also remain one of the critical indicators for traders and anyone interested in the Crypto market.
Summary
BTC Dominance or BTC.D is one of the handy tools for Traders and Holders in the medium and long term. BTC.D will perform better when in large frames like Daily or Weekly. You should also combine Bitcoin Dominance analysis and fundamental analysis for a higher probability of winning.